Stakeholder Analysis Template
 By Jan Suski. I go deep on every review, checking every number against its source and digging up details other coverage misses, a habit from six years of SEO and link building for tech companies. Bylines at Brand24 and Senuto. How the scoring works.
Get the stakeholder analysis template
An Excel workbook that turns a list of names into an engagement plan: a scored stakeholder register, a power-interest matrix that redraws itself, an engagement gap tab and a communication plan.
Download XLSXA stakeholder analysis template is a spreadsheet that lists the people, groups and organizations with a stake in a project, scores each one on power and interest, and turns those scores into an engagement plan. The file on this page is an Excel workbook with four working tabs, a stakeholder register, a scored stakeholder analysis matrix, an engagement assessment matrix and a stakeholder communication plan, plus an instructions tab.
This page covers what a stakeholder analysis does, how it differs from stakeholder mapping, each field in the register, how the power-interest scoring decides who gets what, a step-by-step fill-in, and a worked example with eight stakeholders on a software replacement project. It ends with the mistakes that make a register useless by month two.
It's built for project managers, product and marketing leads, and anyone running a change that needs sign-off from people they don't manage. If a project has a budget holder, a security reviewer and a team who'll have to change how they work, the template fits.
The reason to run one before kickoff is cost. Larry W. Smith's 2000 paper for the Project Management Institute says the analysis is best done before a project is initiated, because a blocker found at kickoff costs a meeting and a blocker found at go-live costs the schedule.
Download the free stakeholder analysis template
Download the stakeholder analysis template (XLSX)Four working tabs plus instructions: a stakeholder register, a power-interest scoring matrix with live quadrant and priority formulas, an engagement assessment matrix with current and desired levels, and a communication plan, pre-filled with the Ferncastle worked example.
The stakeholder analysis template opens in Excel, Google Sheets and LibreOffice Calc. Every formula is a plain IF, MATCH or multiplication, so nothing breaks on import, and the italic example rows can be overwritten or deleted. The template ships with eight filled rows and 40 blank ones.
What a stakeholder analysis does
A stakeholder analysis answers three questions in order: who is involved, how much influence each individual or group has over the project, and what each of them needs from you. The answers go into one stakeholder analysis template, so the whole project team stays on the same page and works off one list of key stakeholders.
Smith's PMI paper breaks the work into five steps: identify the stakeholders, identify their interests and impact, assess importance and influence, outline assumptions and risks, then finish by defining how each one participates over the course of the project. Smith treats importance and influence as two separate scores.
The template follows that order tab by tab, and its matrix tab redraws the map from the scores, so a team that has never run one can complete it without a facilitator.
The output is a ranked list of people and groups, with the expectations of each written next to their score. A finance lead with budget authority and little day-to-day interest gets a monthly one-page summary; a sales leader whose team will live in the new tool gets a weekly meeting. Without the scoring, both get the same status email and it falls on deaf ears with one of them.
Conducting the analysis before kickoff also protects resources. Stakeholder mapping shows which groups need hours of attention and which need a monthly note, so the team can prioritize stakeholders based on their scores and spend its meetings where the influence is.
The same scores show where resources are being wasted on people who'd be happy with a newsletter. In project management terms, it's the input to every engagement and communication decision that follows, and the place to find the support and budget a project needs before it asks for them.
The four tabs in the template
Stakeholder register
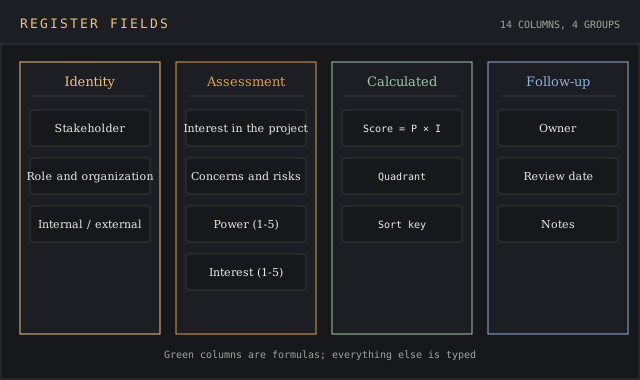
The register is the master list in the template, one row per stakeholder. Identify every relevant group, then name the individual who speaks for it. "IT" can't attend a meeting; the head of IT security can.
| Column | What goes in it |
|---|---|
| Stakeholder | Named person, or group if no single owner exists |
| Role and organization | Job title, team, internal or external |
| Interest in the project | What they want from it, in one line |
| Concerns and risks | What they fear, and what happens if they oppose it |
| Power (1-5) | Ability to approve, block, fund or staff the project, and influence over those who can |
| Interest (1-5) | How much the outcome and its impact change their work |
| Priority score | Formula: power times interest, 1 to 25 |
| Quadrant | Formula: Manage closely, Keep satisfied, Keep informed or Monitor |
| Owner | Who on the project team owns the stakeholder relationships for that row |
| Review date | When the row gets rescored |
Teams skip the concerns column and regret it, though it's integral to the whole template and the impact of leaving it empty shows up later. Stakeholder expectations you write down early can be managed effectively; the ones you find late arrive as conflicts. Writing down that procurement fears a second vendor contract, or that legal needs a data processing agreement, turns a surprise into a task with an owner and nips it in the bud.
Stakeholder analysis matrix
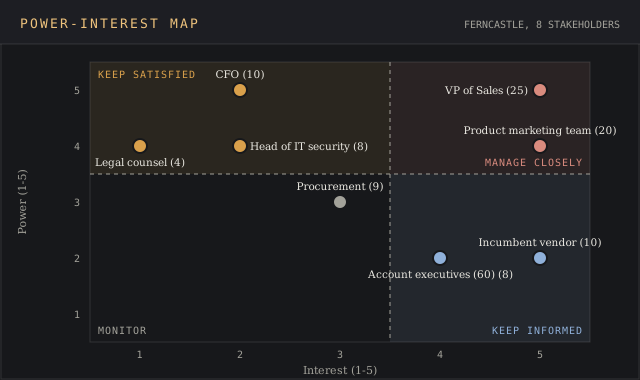
The stakeholder analysis matrix plots each row on the power-interest map, the grid usually credited to Aubrey Mendelow. The Open University's course on IT systems calls it Mendelow's matrix and dates it to 1991. Power runs up the vertical axis, interest along the horizontal, and the quadrant decides the engagement strategies for everyone in it.
- Manage closely (high power, high interest): joint planning, regular one-to-one meetings, early sight of decisions.
- Keep satisfied (high power, low interest): short updates at decision points, never a flood of detail. Their influence is real even when their attention isn't.
- Keep informed (low power, high interest): regular news, demos and a channel for their questions.
- Monitor (low influence, low interest): general updates, plus a check that nothing has moved them up the grid.
The template treats 4 and 5 as high on both axes. A 3 lands low on purpose: if you can't decide if someone has power, the honest answer is a 3 and a review date. The UK government's Analysis Function guidance goes further and has three people score each stakeholder from 1 to 10, then averages the scores, which stops one scorer's grudge from reaching the map.
Stakeholder mapping on two axes has a limit. Influence moves: a low-power group that organizes, or a manager who gains a budget, crosses the map in a week. So each row carries a review date, and the template keeps the stakeholder map on its own tab, redrawn from the register every time the scores change. Keep an eye on anyone sitting at a 3.
Engagement assessment matrix
The third tab of the template records each stakeholder's level of involvement today and the level the project needs, on five levels: Unaware, Resistant, Neutral, Supportive and Leading. Smartsheet's template guide marks the current level C and the desired level D; PMI's PMBOK Guide lists the same matrix under Plan Stakeholder Engagement. The template converts both to numbers 1 to 5 and computes the gap, so the strategies to close each one can be sorted by size.
Closing the gap is the work, and it's the column to analyze first. A stakeholder at Neutral who only needs to stay Neutral costs nothing; a team at Unaware who must reach Supportive by go-live is a three-step gap and the biggest line in the communication plan. A Resistant rating is a red flag that needs a named owner the same week.
Stakeholder communication plan
The last tab of the template turns the scores into a stakeholder communication plan, one row per audience: what each stakeholder needs to hear, the channel, the frequency, the owner and the next touchpoint. Smith's paper calls these information requirements of type, frequency and format, and they're the communication requirements every later status update has to meet.
A plan that says who will communicate what, and when, keeps a quiet stakeholder from assuming the worst and brings a new sponsor up to speed in one read.
How to fill in the template, step by step
- List everyone. Get the ball rolling with two or three people from different teams and identify every group and organization the project touches, inside and outside the company, plus every external partner. A cross-team project fills more rows than anyone expects, so leave no stone unturned at this stage.
- Merge and name. Identify who is involved in each decision. Collapse duplicates and replace group names with a named individual wherever one owns the decision.
- Write the interest and concern lines. One line each. If you can't write the concern, you haven't talked to them yet; acknowledge it in the first meeting and fill it in after.
- Score power and interest from 1 to 5. The key factors are the ability to approve, block, fund or staff the project and the influence a stakeholder holds over the people who do. Seniority alone scores nothing. The formulas determine the priority score and quadrant.
- Set current and desired engagement. Pick C and D levels on the engagement tab and analyze the gap column; that's where the template shows who needs the most work.
- Create the communication plan. Start with the Manage closely rows and the biggest gaps, then set channel, frequency and owner for the rest, and align each row with the project's priorities for that phase.
- Set review dates. Rescore at each phase gate, and any time a stakeholder changes role or a decision changes scope. Complete the first pass of the template in an afternoon and refine it in week two.
Worked example: replacing a competitive intelligence platform
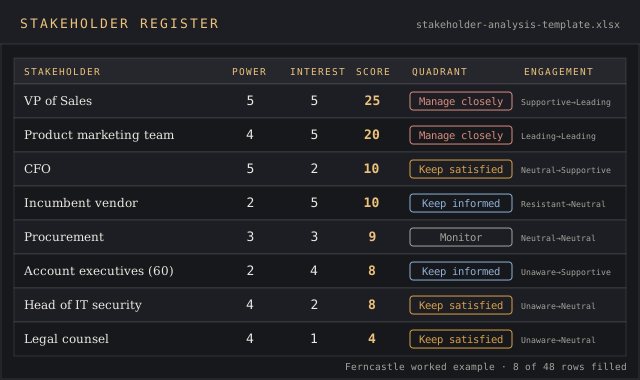
Ferncastle is a hypothetical 220-person B2B software company. Its product marketing team, which runs the current tool, wants to swap its competitive intelligence platform for a cheaper one with a sales-facing battlecard feature, and the contract with the incumbent renews in five months. Product marketing owns the project and fills in the stakeholder analysis template in week one, before the first vendor demo and before anyone opens a vendor evaluation scorecard.
| Stakeholder | Power | Interest | Score | Quadrant | Current | Desired | Gap |
|---|---|---|---|---|---|---|---|
| VP of Sales | 5 | 5 | 25 | Manage closely | Supportive | Leading | 1 |
| Product marketing team | 4 | 5 | 20 | Manage closely | Leading | Leading | 0 |
| CFO | 5 | 2 | 10 | Keep satisfied | Neutral | Supportive | 1 |
| Incumbent vendor | 2 | 5 | 10 | Keep informed | Resistant | Neutral | 1 |
| Procurement | 3 | 3 | 9 | Monitor | Neutral | Neutral | 0 |
| Account executives (60) | 2 | 4 | 8 | Keep informed | Unaware | Supportive | 3 |
| Head of IT security | 4 | 2 | 8 | Keep satisfied | Unaware | Neutral | 2 |
| Legal counsel | 4 | 1 | 4 | Keep satisfied | Unaware | Neutral | 2 |
The priority score ranks attention and the quadrant sets the mode. Here's how the stakeholder map reads. The VP of Sales tops both, so she gets a weekly 30-minute check-in and a seat on the vendor demo. The CFO scores 10 but sits in Keep satisfied: a one-page cost comparison at the monthly budget review, nothing more. Her influence is the budget line, and that's the only thing she needs to see move.
The biggest gap belongs to the 60 account executives, at three steps from Unaware to Supportive. Their power is low, so the grid alone would park them in Keep informed and move on. The engagement tab flags them as the largest piece of work, because a battlecard tool nobody opens is a failed project, whatever the contract saves. A score of 2 on power doesn't mean a small impact on the result. They get a fortnightly Slack update and two enablement sessions before go-live.
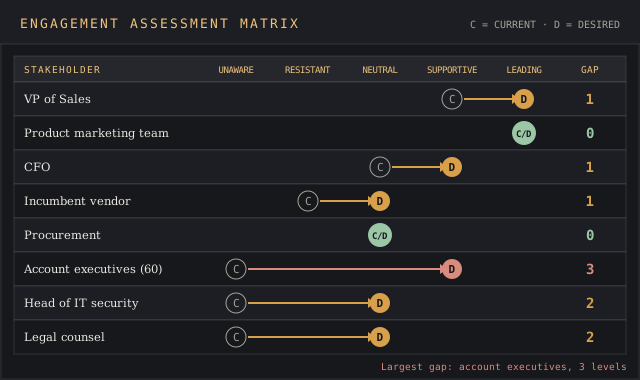
Two rows sit at a gap of 2: IT security and legal, both at Unaware. Neither cares about battlecards, and either can stop the contract. Each gets one scheduled review in month two to ensure their sign-off lands before the renewal date, with the security questionnaire and the data processing agreement sent a week ahead. That's a stitch in time saves nine: a two-week security review run in month four would push go-live past the renewal date.
| Stakeholder | Needs to hear | Channel | Frequency | Owner |
|---|---|---|---|---|
| VP of Sales | Shortlist, demo dates, rollout plan | 1:1 meeting | Weekly | Head of product marketing |
| CFO | Cost against current contract | One-page summary | Monthly | Head of product marketing |
| Account executives | What changes, when, training dates | Slack channel and enablement sessions | Fortnightly | Sales enablement lead |
| Head of IT security | Vendor security questionnaire | Scheduled review | At shortlist and contract | Project manager |
| Incumbent vendor | Renewal decision and offboarding dates | Email from account owner | At decision | Head of product marketing |
Stakeholder analysis vs stakeholder mapping
Stakeholder mapping is the picture: names plotted on a grid so teams can see who sits where. Stakeholder analysis is the table behind the picture, with the reasons, concerns, engagement gaps and the communication plan that follow from the scores. The two overlap, and most projects need both: the map is one tab of the analysis.
A picture is worth a thousand words in a kickoff deck, which is why stakeholder mapping is the step most teams stop at. A stakeholder map without a register behind it can't say why the CFO sits where she does, or what she needs to hear next month. The analysis template keeps the reasons, so the map can be redrawn and still make sense.
If you only need the visual for a kickoff deck and want to create one fast, the stakeholder map template is the lighter file and covers the Mitchell, Agle and Wood salience model. Reach for this stakeholder analysis template when the project runs past a quarter and somebody has to keep the plan current.
Common mistakes with a stakeholder analysis
- Scoring seniority as power. A director with no say over budget or approval is a 3. The security engineer who signs off on vendors is a 4.
- Listing groups with no owner. "Customers" or "the sales team" can't be managed. Name the individual who speaks for them.
- Running it once. Stakeholder mapping is a snapshot. Smith's paper says the analysis stays useful throughout the project as a tool to reassess key issues. A register last scored at kickoff is wrong by the first phase gate, and skipping the rescore is how a team drops the ball on a stakeholder who changed roles.
- Skipping the concerns column. Expectations you didn't write down are the ones that surface as conflicts in a steering meeting.
- Sharing the raw scores. A row that reads "Legal: interest 1" is accurate and will start an argument if it leaks. Keep the workbook with the project team, ensure only the communication plan goes out, and send stakeholders that tab; transparency about the plan helps, transparency about a score of 1 doesn't.
- Treating the grid as the answer. Stakeholder mapping tells you where someone sits. It doesn't tell you what to say to them, which is what the communication plan tab is for.
Excel, Google Sheets or a dedicated tool
Excel or Google Sheets handles a single project's register, and the file sits next to the rest of the project management plan. The workbook needs no macros, so it uploads to SharePoint or Google Drive and the project team edits one copy. Sheets wins when several owners update their own rows; Excel wins when the file goes to a client. Either way, one shared template copy means nobody works off last month's map.
Past one project, the register starts to repeat across files and a dedicated tool earns its cost. Stakeholder management platforms keep stakeholder records, relationships and engagement logs in one database across projects, which is how organizations managing stakeholders at scale avoid five versions of the same contact. For a single project, the spreadsheet is the faster start.
FAQ
How do I create a stakeholder matrix?
List every stakeholder, assess each on power and interest from 1 to 5, then plot them on a two-by-two map with power on the vertical axis. Anyone scoring 4 or 5 on both goes in Manage closely; the template draws the quadrant from the scores by formula.
What is a stakeholder matrix?
A grid that groups stakeholders by two scores, usually power and interest, and assigns an engagement strategy to each quadrant. The common version is Mendelow's power-interest grid, with four quadrants: manage closely, keep satisfied, keep informed and monitor.
What is the RACI matrix for stakeholders?
RACI, a project management chart, assigns each task a Responsible, Accountable, Consulted and Informed party. It answers who does what on each deliverable. A stakeholder analysis answers who needs managing and how; most projects keep both, and the RACI chart's Informed column is a good place to check the analysis missed nobody.
How to make a stakeholder communication plan?
Start from the scored register in the template. For each stakeholder, write what they need to hear, the channel, the frequency and the owner, starting with the Manage closely rows and the biggest engagement gaps. Add a next-touchpoint date so the plan can be checked against the calendar, and name who will communicate each message.
What does a stakeholder analysis do?
It identifies who can affect a project, ranks them by power, influence and interest, and records what each one needs to support the work effectively. The result decides where the project team spends its time and which concerns get handled before they turn into blockers.
Can you provide an example of stakeholder mapping?
In the worked example above, stakeholder mapping for a software company swapping its competitive intelligence platform plots eight stakeholders. The VP of Sales and product marketing land in Manage closely, the CFO, IT security and legal in Keep satisfied, the sales reps and the incumbent vendor in Keep informed, and procurement in Monitor.
What are some tools used for stakeholder analysis?
A spreadsheet template covers most single projects, and the template on this page includes the map, so you won't need a second tool to draw it. Whiteboard tools such as Miro suit a live stakeholder mapping workshop, and dedicated stakeholder management software suits organizations that track the same stakeholders across many projects.
Bottom line
Use this stakeholder analysis template when a project needs sign-off or behavior change from people outside your team, and when it runs long enough that the list will change.
It's the working file for managing stakeholders; the map is the summary. The scores tell you where to spend your hours; the engagement gap tells you which relationship is the real workload. In the example, the impact is concrete: a late security review costs the renewal date and an ignored sales team costs the rollout, and only the analysis shows both from week one.
For a one-slide picture of who sits where, the stakeholder map is enough. For the risks the stakeholders raise, and the strategies to handle them, carry them into a risk assessment matrix.