Break Even Calculator
 By Jan Suski. I go deep on every review, checking every number against its source and digging up details other coverage misses, a habit from six years of SEO and link building for tech companies. Bylines at Surfer, Brand24, and Senuto. How the scoring works.
How it works
Enter your fixed costs for a period, the selling price per unit and the variable unit cost, and this break even calculator divides the fixed costs by what each unit earns after its variable costs. It returns the break even point in units, the break even revenue and the contribution margin ratio, recalculated as you type.
Add expected unit sales and a target profit and it also shows the profit generated at that sales volume, your margin of safety, and how many units you need to sell to hit the target. Results appear below the form fields as you type, with a profit-by-sales-volume table for three volumes you can edit.
Who it's for
Founders testing a business model before launch, owners pricing a new product line, and finance leads who want a fast break even analysis without building a spreadsheet. This break even point calculator also works as a check on the break even number inside a lender's business plan or a feasibility analysis.
Reading the results
The headline figure is how many units you need to sell before the period turns a profit. Every additional unit past that point adds its full margin: at a $50 unit price and a $20 variable unit cost, unit 401 adds $30. Margin of safety shows how far expected sales can fall before the period loses money, 27.3% in the default example.
When to use it
- Testing a pricing strategy: try three prices and watch the break even point move.
- Before signing a lease or a hire: add the new rent or salary to fixed costs and see the extra units required.
- Setting a monthly sales target: break even units are the floor every target has to clear.
- Checking a supplier quote: cheaper raw materials lower variable costs and raise the margin on each unit you sell.
The price has to exceed the variable cost per unit. At this price every sale adds to the loss, so no sales volume breaks even.
Break-even units
0
Break-even revenue
$0
Contribution margin
$0
Profit at expected sales
$0
Margin of safety
0%
Units for target profit
0
Profit by sales volume
| Scenario | Units | Revenue | Total costs | Profit |
|---|---|---|---|---|
| Low | $0 | $0 | $0 | |
| Expected | 0 | $0 | $0 | $0 |
| Stretch | $0 | $0 | $0 |
Break-even revenue = fixed costs ÷ contribution margin ratio
Units for target profit = (fixed costs + target profit) ÷ (price − variable cost per unit)
Margin of safety = (expected units − break-even units) ÷ expected units
Formulas from the U.S. SBA and OpenStax Principles of Managerial Accounting, sections 3.2 and 3.5. Every number comes from your inputs.
The result assumes one price and one variable cost at every volume. Before you act on it, check the variable cost per unit against your last three supplier invoices, confirm which costs in your profit and loss statement stay fixed when volume doubles, and compare expected unit sales with your actual sales over the trailing six months.
How this is calculatedSBA formulas, contribution margin, target profit
The four break even analysis inputs are fixed costs, price per unit, variable cost per unit and, optionally, expected unit sales. The calculator runs the formulas the U.S. Small Business Administration publishes (page last modified 8 September 2026): break-even point in units = fixed costs ÷ (sales price per unit − variable cost per unit), and break-even point in sales dollars = fixed costs ÷ contribution margin.
Contribution margin is selling price minus the variable unit cost. The SBA defines the contribution margin ratio as that difference divided by the sale price, so a $50 product with $20 in variable costs carries a 60% ratio. Total costs sum fixed costs and total variable costs, and the break even point sits at the number of units where total revenue equals total costs.
Three more outputs use the cost-volume-profit formulas in OpenStax's Principles of Managerial Accounting:
- Units for a target profit: (fixed costs + target profit) ÷ margin per unit, from section 3.2.
- Profit at expected unit sales: expected units × margin per unit − fixed costs.
- Margin of safety: (expected sales − break-even sales) ÷ expected sales, from section 3.5.
Fixed costs are the costs required to stay open for the period, and they remain constant across its production volume: rent, salaries, insurance, software. Variable costs move with units produced or sold, like raw materials, packaging, card fees & shipping. Total variable costs are the variable unit cost times units sold. Every one of the calculated values comes from your own inputs, and break-even units round up to the next whole unit.
Worked example$50 price, $20 variable cost, $12,000 a month
Take a product with a $50 unit price, $20 in variable costs per unit and $12,000 a month in fixed expenses. Each sale contributes $30, a 60% ratio, so the break-even point is 12,000 ÷ 30 = 400 units, or $20,000 in total revenue. Those are the default values in the calculator above.
Expected unit sales of 550 produce 550 × $30 − $12,000 = $4,500 in profit, a margin of safety of 150 ÷ 550 = 27.3%. A $6,000 target needs (12,000 + 6,000) ÷ 30 = 600 units sold. At 300 units the month loses $3,000, and at 800 it makes $12,000.
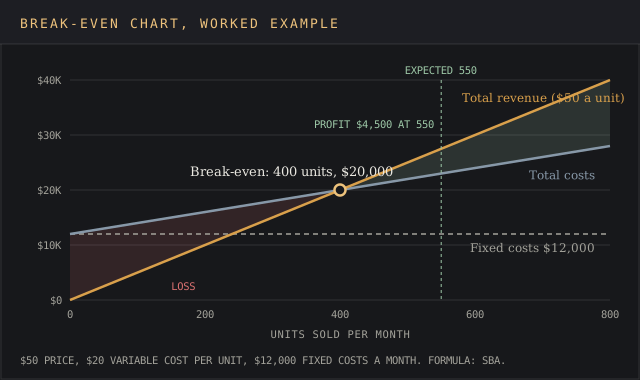
The sales volume line graph above plots the same month: the total revenue line starts at zero, the total costs line starts at $12,000, and they cross at 400 units. OpenStax runs identical arithmetic on its Hicks Manufacturing example, where a $100 price, a $20 variable cost and $18,000 of monthly fixed costs break even at 225 units, or $22,500 in total revenue. Type those three numbers into the calculator and it returns the same two figures.
What this does and doesn't tell youstraight-line costs, one product, cash timing
The model draws straight lines. Price holds at every volume, variable costs per unit hold as production increases, and fixed costs stay flat. Real costs bend: a supplier discount lowers the variable unit cost past a volume threshold, and a second shift adds a new block of fixed costs. Run the calculator once per cost tier when a step change is coming.
It handles one product at a time. A company's break even point across several products depends on a weighted margin from its sales mix, which shifts as production increases on some lines and drops on others. For a quick read, enter the average price and average variable costs across the range.
Timing sits outside the formula. A month that covers its costs on paper still leaves the bank account short when customers pay on 60-day terms, so don't count your chickens before they hatch: pair the result with a cash-flow forecast or the burn rate calculator. Expected unit sales should trace back to a sizing estimate such as the market potential calculator.
The calculator is a self help tool for illustrative purposes. For decisions tied to your individual circumstances, such as a loan or a lease, take the numbers to an accountant.
How do you calculate the break even point?
Divide total fixed costs by price minus the variable unit cost. With $12,000 of fixed costs, a $50 price and $20 in variable costs, that's 12,000 ÷ (50 − 20) = 400 units. Multiply by the price for break-even revenue: $20,000. Round a fractional answer up, since at 363.6 units the 364th sale is the first one covering fixed costs in full.
What is a good break even point?
A good one sits well below the sales you already make. Measure it with margin of safety against your own trailing sales: if the last six months averaged 450 units, a 400-unit break-even leaves 50 units, or 11.1%, of cushion. When the gap is thin and the fix is pricing, the price optimization tools ranking covers the software built for it.
How do I do a break even analysis in Excel?
A break even analysis in Excel takes three cells. Put fixed costs in B1, price per unit in B2 and variable cost per unit in B3. Enter =B1/(B2-B3) for break-even units and =B1/((B2-B3)/B2) for break-even revenue. With a target profit in B4, =(B1+B4)/(B2-B3) returns the number of units to sell. On an existing profit model, Goal Seek (Data > What-If Analysis) sets the profit cell to 0 by changing the units cell.
What happens to the break even point if fixed costs increase?
It rises in step. Adding $3,000 a month of rent to the $12,000 example lifts the break-even point from 400 to 500 units, because each unit still contributes $30 of its selling price toward covering fixed costs.
How does a lower variable cost change the break even point?
Cutting variable costs from $20 to $17 a unit lifts the margin to $33 and drops break-even to 364 units (12,000 ÷ 33 = 363.6, rounded up). Each additional unit sold now keeps $33, and the $3 saving cuts 36 units off the monthly target.
Embed this calculator on your sitefree iframe widget, credit link included
Drop this on any page and it renders the calculator above, live, with no login or install. It's free to use; the only ask is leaving the credit link in place.