Market penetration: how to calculate the rate and pick a strategy
 By Jan Suski. I go deep on every review, checking every number against its source and digging up details other coverage misses, a habit from six years of SEO and link building for tech companies. Bylines at Surfer, Brand24, and Senuto. How the scoring works.
The short version 11 points · 40 seconds
- 01Penetration is customers over potential customersTimes 100, counted in one fixed unit
- 02Fix the unit first: accounts, households or salesA stock and a flow give different rates
- 03The calculation takes five steps, rerun quarterlySame unit and same source every time
- 04The denominator decides the answer for one companyToast reads as 26.5% or 20% on one count
- 05Market share divides sales by total market salesSamsung held 22.7% of Q2 2026 shipments
- 06A healthy rate depends on the adoption stageSmartphones at 91%, electric cars above 20%
- 07Spotify's paid tier is 38.6% of its users300 million Premium of 777 million users
- 08Penetration sells existing products to the existing marketThe lowest-risk of four Ansoff routes
- 09Four levers: pricing, promotion, channels, productAcquisitions are the fast route
- 10A rate goes stale when its source stops publishingNetflix ended quarterly counts in 2025
- 11Track acquisition, retention and competitor responseA SMART target gives the rate a deadline
Market penetration is the share of a target market that already buys from you: the number of customers divided by the potential customers in that market, multiplied by 100. A hypothetical reservation-software vendor with 2,600 paying restaurants, out of the 258,626 full-service restaurants Census counted in 2023, has a market penetration rate of 1.0%.
This lesson picks up where how to size a market left off. Sizing produces the denominator and sets a target capture rate. Market penetration measures how much of that market a company holds today, which tells a team if growth can still come from its current buyers or has to come from somewhere new.
The lesson is for analysts, founders and product marketers who report the figure to a board or build a plan around it. It uses figures from IDC, Pew Research Center, the IEA, the Census Bureau, Toast, Spotify and Netflix.
What market penetration measures, and the unit you count in
Understanding market penetration starts with the count. Market penetration focuses on how far a company penetrates its target market with one product or brand. The numerator is the number of customers, users or units sold. The denominator is the total target market size in the same unit: the whole potential market of accounts, households or people who could buy. Multiply the unpenetrated share by revenue per customer and you have the potential earnings still available.
The unit changes the answer. Penetration of a population counts people or accounts that own a product on a date, the way Pew counts adults with a smartphone. Penetration of sales counts the share of new purchases in a period, the way the IEA counts electric cars in new car sales. One is a stock, the other a flow, and a rate quoted without its unit is a red flag.
Brand penetration is the narrow version: the brand's customer population as a share of the category's buyers in a period. The gap between brand and category penetration is the room a brand still has in the existing market before growth has to come from new markets.
How to calculate market penetration rate
To calculate market penetration, use one formula: market penetration rate = (number of customers ÷ total target market size) × 100. The work sits in the inputs, and the unit and date stay fixed every time the figure is refreshed.
- Define the target market in one sentence: who buys, where, in what unit.
- Count the total target market from a public source, such as a Census establishment count.
- Count your existing customers in the same unit on a named date.
- Divide customers by the target market size and multiply by 100.
- Rerun it each quarter with the same definitions and log the result.
Take the reservation-software case from the sizing lesson. Census County Business Patterns counts 258,626 full-service restaurants in 2023. A vendor with 2,600 paying restaurants has a market penetration rate of 2,600 ÷ 258,626 × 100 = 1.0%. At 3,900 a year later, it's 1.5%, and those 1,300 new customers are the sales growth that moved it.
Split the 258,626 by state or employee band and the company's market penetration rate per segment shows which customer segments the marketing and sales efforts have reached. The market potential calculator turns the same Census count into TAM, SAM and SOM.
The denominator decides the answer: one company, two rates
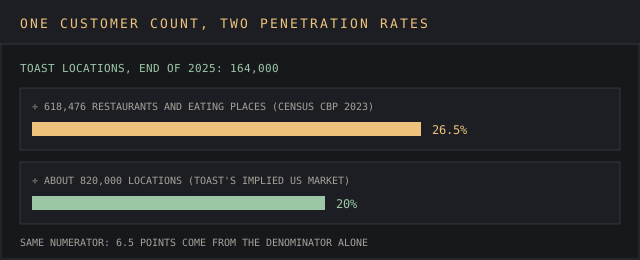
Toast sells point-of-sale software to restaurants and ended 2025 with approximately 164,000 locations, after a record 30,000 net adds, per its fourth-quarter 2025 results. Its 2025 Form 10-K estimates its US locations "account for approximately 20% of the U.S. restaurant market."
Divide the same 164,000 by the 618,476 restaurants and other eating places Census counted in 2023 and the market penetration rate is 26.5%. Toast's 20% implies a total estimated market of about 820,000 locations. The customer count stayed put, and six and a half points of market penetration came from the denominator alone. The 164,000 also includes locations outside the US.
A vendor's figure follows its own definition of a restaurant, and a Census count covers only establishments with paid employees. Pick one, cite it, keep it. The devil's in the details: switching denominators between two reports creates a jump in market penetration that no sales team earned.
Market penetration vs market share
Market share divides a company's sales by total market sales, so it shows how units or revenue split between competitors. Market penetration divides customers by potential customers, so it shows how much of the relevant market population buys at all. A category can sit at 90% penetration while five market leaders split it evenly.
IDC's smartphone market share tracker shows the share side. Shipments fell 7.4% year on year to 276.3 million in the second quarter of 2026. Samsung shipped 62.7 million, a 22.7% market share, and Apple 55.7 million, or 20.2%. Together the two market leaders held 42.9% of the smartphone market, up from 35.7% a year earlier.
Some sites call Apple and Samsung's 42.9% a combined market penetration rate. It's market share in units, and measured in total sales dollars it would differ, because the two sell at different prices.
Pew Research Center's mobile fact sheet shows the penetration side: 91% of US adults own a smartphone, up from 35% in Pew's first smartphone survey in 2011. Samsung can gain market share while US penetration stays flat, by gaining competitors' customers. The market share calculator tracks that contest as relative share and HHI.
Teams that report one metric under the other's name are barking up the wrong tree. Falling share with rising penetration means the category is growing faster than the brand, and rising market share with flat penetration means the brand is taking a bigger slice of a market that has stopped adding buyers. The lesson on market analysis and competition covers what concentration adds.
What a good market penetration rate looks like at each stage of adoption
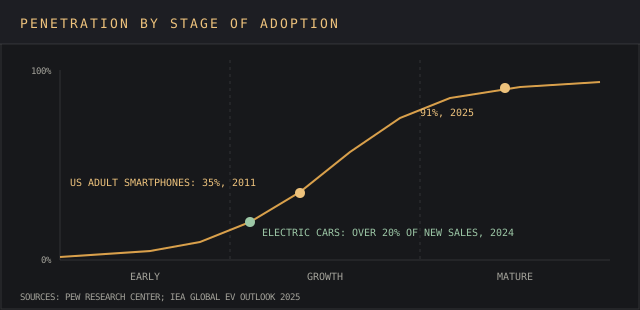
The right rate depends on how far the category has spread. A rate of 20% is late for a product most adults own and early for a category still adding buyers. An average market penetration figure for all consumer products or all B2B products hides that stage. Compare a rate with the category's curve and with similar companies of the same target market size. The formula also assumes market existence, since a category with no buyers yet has no denominator to divide by.
| Category or company | Base | Penetration | Source |
|---|---|---|---|
| Smartphones, 2025 | US adults | 91% | Pew Research Center |
| Smartphones, 2011 | US adults | 35% | Pew Research Center |
| Electric cars, 2024 | New car sales worldwide | Over 20% | IEA |
| Electric cars, 2024 | Car sales in China | Almost half | IEA |
| Electric cars, 2024 | Car sales in the US | Over 1 in 10 | IEA |
| Spotify Premium, Q2 2026 | Spotify's 777 million users | 38.6% | Spotify |
| Toast, 2025 | US restaurant market, Toast's estimate | About 20% | Toast Form 10-K |
Electric cars are mid-curve. The IEA's Global EV Outlook 2025 counts over 17 million sold in 2024, a sales share above 20%, with China near half and the US past one in ten. It projects over a quarter of cars sold worldwide in 2025 will be electric.
Spotify's second-quarter 2026 results count 777 million monthly active users and 300 million Premium subscribers, so 38.6% pay. It's a resourceful business model: free users are the paid tier's potential customers, and converting them can drive sales revenue without adding a single user to its customer base.
A low rate in a mature potential market is the place to read between the lines. If a category sits near 90% and a product with years on sale holds 1% of it, the likely gap is product-market fit, and a price cut won't close it.
Market penetration strategy: the Ansoff quadrant and its four levers
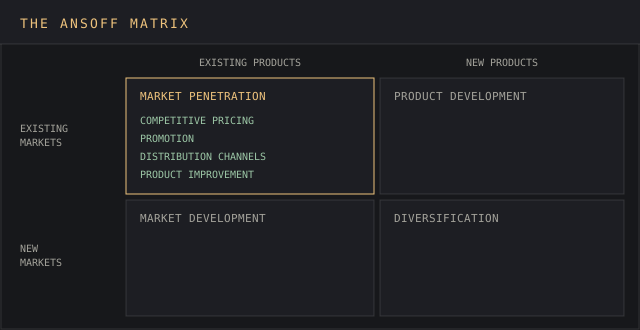
In the Ansoff matrix, market penetration is the quadrant where a company sells existing products in the existing market. Market development takes existing products to new markets, product development brings new products to existing customers, and diversification does both.
Penetration carries the lowest risk of the four routes to business growth, because the product and the buyer are known. As a business strategy it suits a company whose target audience still holds potential customers who haven't bought. The Ansoff matrix template lays out all four quadrants.
A company pulls four levers to increase market penetration, and most business growth strategies built on it combine two or three:
- Competitive pricing: penetration pricing, a bundle or a free trial to attract customers and increase sales among buyers of a rival.
- Marketing campaigns: advertising, loyalty programs and personalized offers that drive repeat purchases from existing customers.
- Expanding distribution channels: retailers, marketplaces or partners that reach potential customers current channels miss.
- Product improvement: features, quality or service that give a buyer a reason to switch.
The marketing strategies behind a market penetration strategy differ by market, because the buyers left to win differ. Companies trying to penetrate markets where the category is new, as in many emerging markets, lead with distribution and price. Where nearly everyone owns the product, brand equity decides who switches.
Acquisitions are the fast route to a market penetration strategy's goal: a business seeks more customers by buying a competitor's customer base outright. It's easy to bite off more than you can chew, since the buyer also inherits contracts, churn and integration costs.
Competitor response decides how long a lever works. A price cut that rivals match within a quarter buys sales volume for a quarter. Collect pricing intelligence on rivals' list prices before pulling that lever, and check operational capacity first: support and supply have to handle the new customers a successful market penetration push brings.
Mistakes that make a penetration rate meaningless
A borrowed denominator is the most common mistake. A vendor's figure, a press release's total addressable market and a Census count each define the market differently, and mixing them turns flat sales volume into growth on paper.
A source that stops publishing comes second. Netflix ended 2024 with 301.63 million paid memberships, its count of subscribers, 89.63 million of them in the US and Canada, per its fourth-quarter 2024 earnings letter. The letter says Netflix would stop reporting memberships every quarter from its first-quarter 2025 earnings. Analysts who'd put all their eggs in one basket lost their numerator.
Reading a high rate as the finish line is the third. High market penetration in a mature market leaves little room to increase sales growth from new customers, so the next gains come from price, retention, new customer segments or emerging markets abroad. Marketing campaigns that keep chasing a shrinking pool cost more per customer added.
How to tell if a market penetration strategy is working
Every market penetration strategy starts from the current rate, and that rate is the starting point of every forecast in the go-to-market plan template. A goal implying 40% of the target market in year two, from a standing start of 2%, has no basis in the data, and putting both numbers side by side makes that visible.
Effective market penetration needs a SMART target: specific segment, measurable rate, achievable step, relevance to the plan and a deadline. "Raise penetration of full-service restaurants in Texas from 1.0% to 1.5% by 31 December" passes. "Grow our market presence" fails four of the five.
Read three numbers next to the rate. Customer acquisition shows which marketing strategies brought new customers and what each cost. Retention shows if they stay, because a rate that rises on acquisition and falls on churn is a flash in the pan. A competitor battlecard logs the response the strategy provoked.
FAQ
How do you calculate market penetration?
Divide the number of customers by the total target market size and multiply by 100. A vendor with 2,600 of 258,626 full-service restaurants sits at 1.0%.
What is market penetration vs market share?
Penetration divides customers by potential customers. Market share divides a company's sales by total market sales. Samsung's 22.7% of smartphone shipments is share, and the 91% of US adults who own a smartphone is penetration.
What is a good market penetration rate?
It depends on the category's stage. Smartphones sit at 91% of US adults, while electric cars passed 20% of new car sales in 2024 and are still growing.
Can you give me an example of market penetration?
Toast estimates its US locations at approximately 20% of the US restaurant market. Spotify's Premium subscribers are 38.6% of its monthly active users.
What is market penetration in the Ansoff Matrix?
It's the quadrant for existing products in existing markets, the lowest-risk growth strategy of the four. The others are market development, product development and diversification.
What is market penetration vs market development?
Market penetration sells more of an existing product to the existing market. Market development takes the same product to new markets, such as a new country, industry or customer segment, with more risk because the buyer is new. Both are growth strategies from the same Ansoff grid.
What is a penetration strategy?
A market penetration strategy is a plan to raise the share of a target market that buys an existing product. Among pricing strategies, penetration pricing launches below rivals' prices to win the lion's share of new buyers early.
Bottom line
Market penetration is customers divided by the target market, and the rate is only as good as its denominator. Write down the unit and source, keep both fixed every quarter, report market share under its own name, and choose the market penetration strategy only after that, before any budget goes to new markets.
A borrowed denominator makes a flat quarter look like growth and keeps budgets running at a market that has stopped adding buyers. That choice makes all the difference to what the next plan funds.
Put the rate to work with the market potential calculator: size the market, set the obtainable share, and keep an eye on how far current market penetration sits from it.