Ansoff Matrix Template
 By Jan Suski. I go deep on every review, checking every number against its source and digging up details other coverage misses, a habit from six years of SEO and link building for tech companies. Bylines at Surfer, Brand24, and Senuto. How the scoring works.
Get the Ansoff matrix template
An Excel workbook that sorts every growth idea into one of the four Ansoff quadrants, scores it on revenue, investment and confidence, and shows how the budget splits across the grid.
Download XLSXAn Ansoff matrix template is a two-by-two grid that sorts every growth plan by two questions: is the product new or existing, and is the market new or existing? The four answers give the four growth strategies H. Igor Ansoff set out in the Harvard Business Review in 1957: market penetration, market development, product development and diversification.
This page covers what each quadrant asks of a business, why risk climbs as a plan moves away from existing products and the existing market, the four tabs of the downloadable workbook, a step-by-step fill-in, and a worked example that scores five growth ideas for a $9.6M software vendor.
It's built for the people who sign off on business growth: a founder choosing between a new market and a new product line, a business manager drafting the annual plan, or a management team checking that next year's growth strategy isn't stacked in the riskiest corner of the grid.
The reason to bother is arithmetic. A growth plan drawn up without the grid tends to hand the biggest budget to the most exciting idea, and the most exciting idea usually sits in the diversification corner, where the business has the least market knowledge and the fewest of its established strengths to lean on.
Download the free Ansoff matrix template
Download the Ansoff matrix template (XLSX)Four tabs covering the 2x2 matrix, initiative scoring with live formulas, and a portfolio balance view, pre-filled with the Ledgerline worked example.
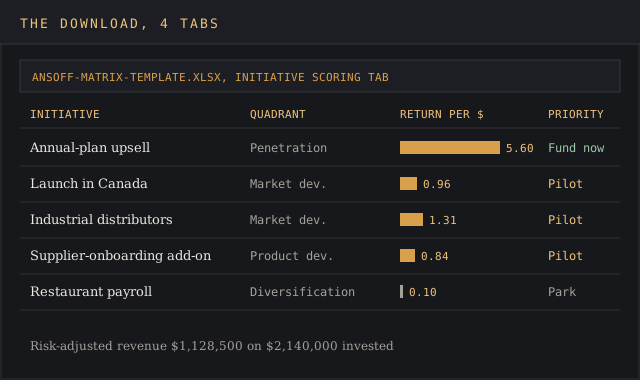
The workbook carries four tabs: instructions, the blank 2x2 Ansoff matrix, an initiative scoring sheet with live formulas, and a portfolio balance view. It ships pre-filled with the worked example further down this page, so every formula shows a real result before you wipe the slate clean for your own existing business.
The file opens in Excel, Google Sheets and LibreOffice Calc. The quadrant, scoring and balance formulas use only IF, AND, SUMIF and COUNTIF, so nothing breaks on import.
What the Ansoff matrix is
The Ansoff matrix, also called the product/market expansion grid or the Ansoff growth matrix, puts products on one axis and markets on the other. Each axis has two values, existing and new, which gives four cells and four distinct growth strategies. Ansoff, an applied mathematician and business manager, published it as "Strategies for Diversification" in volume 35, issue 5 of the Harvard Business Review, pages 113 to 124, per the citation on its Wikipedia entry.
Corporate Finance Institute calls it "a fundamental framework taught by business schools worldwide." It survives in every strategic planning syllabus because it asks so little: two yes-or-no questions per idea. The matrix template turns those two questions into a formula, so each initiative lands in a quadrant by its inputs, and the loudest voice in the room stops deciding where it goes.
The four growth strategies
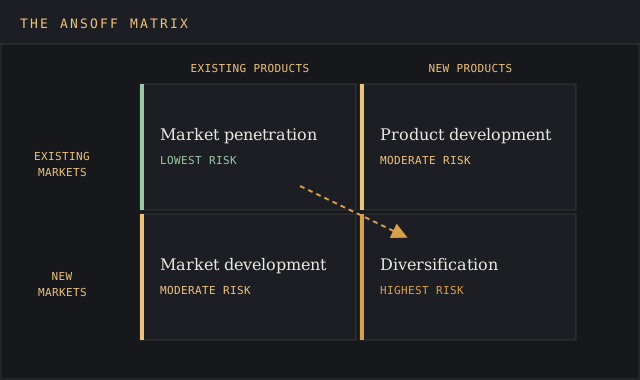
Every growth strategy on the grid is a combination of one product answer and one market answer, so the four boxes are four different growth strategies with four different bills attached. The table lays out what each growth strategy asks of the business and where it sits on the risk gradient.
| Quadrant | Product | Market | Typical tactics | Relative risk |
|---|---|---|---|---|
| Market penetration | Existing | Existing | Adjusting pricing strategies, promotional discounts, targeted advertising, a loyalty program, acquiring competitors | Lowest |
| Market development | Existing | New | Foreign markets, a new region of the domestic market, a different customer segment | Moderate |
| Product development | New | Existing | New features, an extension of the existing product line, licensed or white-label products | Moderate |
| Diversification | New | New | Related or unrelated diversification, often by acquisition | Highest |
Market penetration
A market penetration strategy grows market share in the current market with existing products, and it's the growth strategy most teams under-fund. The Wikipedia entry lists the standard levers: adjusting prices, increasing marketing and promotion, acquiring competitors and improving quality. A loyalty program aimed at existing customers sits here, and so does tightening the distribution process so the product reaches more shelves in the same market.
It's the least risky quadrant because the business already knows the buyer, the price point and the channel. Increasing sales here means more of the same thing, sold to the existing customer base and the wider customer base around it, through promotional efforts and marketing efforts the team has run before. Customer loyalty does most of the work, and increasing sales to a buyer who already trusts the product costs less than winning new customers.
Market development
A market development strategy means selling existing products to new customers: foreign markets and other international markets, a new region of the domestic market, or different customer segments in the same country. CFI's example is Lululemon taking its existing athleisure line into Asia Pacific. Apple's 2009 three-year deal with China Unicom to sell the iPhone in the Chinese market is another, per Macworld's report of the announcement.
International expansion needs research spend on regulation, pricing and logistics before the first sale, which is where the extra risk comes from. A cloud computing company that starts selling its existing storage product to hospitals is running the same play at home: same product, a different market with different buyers and different rules.
Product development
Product development keeps the same market and changes the product. A smartphone maker shipping a new model to customers who own the last one is the textbook case, and it works because brand loyalty carries over to the new thing. A car manufacturer adding an electric version of its best-selling model for the same buyers is another. CFI lists in-house R&D, licensing another firm's product and white-labelling a third party's product as routes in.
Wikipedia rates product development riskier than market penetration and level with market development. The devil's in the details: a new product can flop with customers who love the old one, and building it can require significant investment before a single unit sells.
Diversification
A diversification strategy needs product development and market development at once, so it's the growth strategy with the most moving parts, which is why every source on the subject calls it the riskiest strategy on the grid. Related diversification keeps a link to the company's established strengths, which makes it the safer diversification strategy of the two.
CFI's example is a leather shoe producer making leather car seats, reusing its skill at sourcing raw materials and the same production process.
Unrelated diversification has few or no synergies, and the business enters a market where it has no prior experience. Wikipedia keeps one counterpoint worth noting: a firm spread across several unrelated markets can lower its overall portfolio risk, since one market's bad year doesn't sink the rest. That works for a holding company and is a long shot for a 60-person firm with one product line, which risks biting off more than it can chew.
Why risk rises across the grid
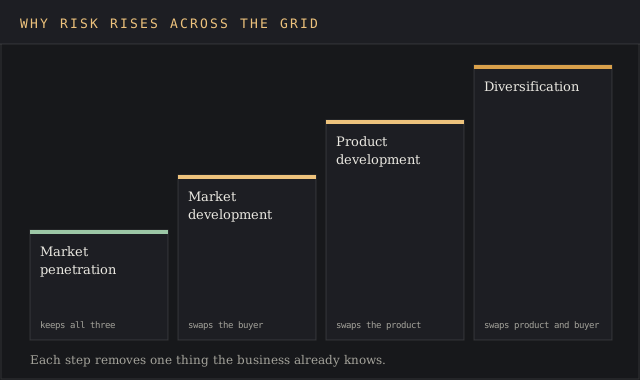
Risk climbs as a plan moves from market penetration to diversification because each step removes something the business already knows.
- Market penetration keeps the product, the buyer and the channel.
- Market development keeps the product and swaps the buyer.
- Product development keeps the buyer and swaps the product.
- Diversification swaps both, so the management team is guessing on two fronts at once.
The grid treats diversification as a higher bar to clear, and the template enforces that with a confidence column: every initiative's year-one revenue gets multiplied by the team's honest probability that it lands. Most growth opportunities look different once a 15% figure sits next to them, and the potential risks stop hiding behind a big revenue estimate.
An idea with a strong value proposition still has to show it can win new customers in a market the team has never sold to.
The four tabs inside the template
| Tab | What it holds | Key formula |
|---|---|---|
| Instructions | How to fill each tab, the priority rule and the color key | None |
| Ansoff Matrix | The blank 2x2 grid with Existing and New on both axes and one box per quadrant for initiative names | None |
| Initiative Scoring | One row per idea: product, market, quadrant, year-one revenue, investment, confidence, risk-adjusted revenue, return per dollar, priority | =IF(AND(C5="Existing",D5="Existing"),"Market penetration",...) |
| Portfolio Balance | Count, investment and risk-adjusted revenue per quadrant, each as a share of the total | =SUMIF(Quadrant,"Diversification",Investment) |
The Portfolio Balance tab is the part most free Ansoff templates leave out, and it's how the grid compares growth alternatives side by side. A grid with four boxes of sticky notes shows where ideas sit; the balance view shows where the money sits, which is the question the board asks.
How to fill in the Ansoff matrix, step by step
List every growth initiative on the table. Pull from the annual plan, the product backlog, customer feedback and whatever senior managers floated last quarter. One idea per row.
Answer the two questions. Product: does it exist as sold today? Market: does the business already sell to this buyer in this place? A new pricing tier is an existing product. A new country is a new market. The quadrant column fills itself.
Estimate year-one revenue and investment. Use the same horizon on every row, or the comparison breaks.
Set a confidence figure. The probability, from 0% to 100%, that the initiative hits its revenue estimate. This is the column where the risk gradient turns into numbers.
Read the priority column. A return of 2.0 or more per dollar reads Fund now, 0.75 to 1.99 reads Pilot, under 0.75 reads Park.
Check the Portfolio Balance tab. If most of the investment sits in one quadrant, the plan has put all its eggs in one basket, and the review starts there.
Copy the funded rows onto the Ansoff Matrix tab. The grid is the one-slide summary business leaders read; the scoring tab is the proof behind it.
Worked example: five growth initiatives for a $9.6M software vendor
Ledgerline, a fictional company built for this example, sells accounts-payable automation software to 410 mid-size US manufacturers and carries $9.6M in annual recurring revenue. Its management team brought five ideas to the planning meeting, each with its own growth strategy attached, and the scoring tab sorted them like this.
| Initiative | Quadrant | Year-1 revenue | Investment | Confidence | Risk-adj. revenue | Return per $ | Priority |
|---|---|---|---|---|---|---|---|
| Annual-plan discount and usage upsell | Market penetration | $480,000 | $60,000 | 70% | $336,000 | 5.60 | Fund now |
| Launch in Canada | Market development | $600,000 | $250,000 | 40% | $240,000 | 0.96 | Pilot |
| Sell to industrial distributors | Market development | $350,000 | $120,000 | 45% | $157,500 | 1.31 | Pilot |
| Supplier-onboarding add-on module | Product development | $520,000 | $310,000 | 50% | $260,000 | 0.84 | Pilot |
| Payroll software for restaurants | Diversification | $900,000 | $1,400,000 | 15% | $135,000 | 0.10 | Park |
On raw revenue the restaurant payroll idea looks like the winner at $900,000, and it took the lion's share of the meeting. On the scoring tab it's the weakest row by a wide margin: 15% confidence turns it into $135,000 of expected revenue against $1.4M of investment, a return of 10 cents per dollar.

The Portfolio Balance tab puts the problem in one table.
| Quadrant | Initiatives | Investment | Share | Risk-adj. revenue | Share |
|---|---|---|---|---|---|
| Market penetration | 1 | $60,000 | 2.8% | $336,000 | 29.8% |
| Market development | 2 | $370,000 | 17.3% | $397,500 | 35.2% |
| Product development | 1 | $310,000 | 14.5% | $260,000 | 23.0% |
| Diversification | 1 | $1,400,000 | 65.4% | $135,000 | 12.0% |
| Total | 5 | $2,140,000 | 100% | $1,128,500 | 100% |
That split is a red flag. Diversification holds 65.4% of the money and returns 12.0% of the expected revenue. Market penetration holds 2.8% of the money and returns 29.8%. The unglamorous discount-and-upsell row is the only one to clear Fund now, because it can leverage existing products the customer base already pays for.
Ledgerline's revised growth strategy funds the upsell, pilots Canada and the distributor segment, pilots the add-on module, and parks restaurant payroll until a related diversification route turns up, one closer to the company's established strengths in manufacturing finance. The two pilots then move into a go-to-market plan template with owners and launch dates.
Practical examples: Coca-Cola and the Ansoff matrix
Coca-Cola doesn't publish an Ansoff grid, but two of its best-documented moves map onto the quadrants cleanly.
- Market penetration. Share a Coke started in Australia in 2011 with 150 popular first names printed on bottles. Coca-Cola says it sold more than 250 million named bottles and cans that summer in a country of just under 23 million people, and the campaign has since run in more than 70 countries. Same drink, same buyers, more sales.
- Related diversification. On 3 January 2019 Coca-Cola closed its $4.9 billion purchase of Costa from Whitbread, a coffee chain operating in more than 30 countries. Coffee shops were a new market and hot coffee a new product for a soft-drink company, with a link back to its beverage distribution.
The Share a Coke campaign is a reminder that penetration work can generate interest at scale without touching the product. The Costa deal shows the other end of the grid: a cheque large enough that the confidence column matters more than the revenue column.
Ansoff matrix vs the BCG matrix
Both are 2x2 grids and both show up in the same strategy decks, so they get mixed up. The BCG growth-share matrix, popularized by Bruce Henderson in his 1970 essay "The Product Portfolio," sorts existing products by market growth and relative market share into stars, cash cows, question marks and dogs.
| Ansoff matrix | BCG matrix | |
|---|---|---|
| Question | Where should the next growth come from? | Which existing products get the cash? |
| Axes | Product (existing or new) by market (existing or new) | Market growth rate by relative market share |
| Input | Proposed growth initiatives | Current products or business units |
| Output | Four growth strategies | Stars, cash cows, question marks, dogs |
| First published | 1957 | 1970 |
Run BCG first to see which existing products throw off the cash, then Ansoff to decide where that cash goes next. The two answer different business strategy questions and sit side by side without overlap. A business strategy deck that carries both usually reads BCG on page one and Ansoff on page two.
Common mistakes with an Ansoff matrix
- Calling a product new when it's a feature. A new pricing tier or a rebrand is still the existing product. Filing it under product development inflates the risk and buries a cheap penetration win.
- Calling a market new when it's the same buyer. A new sales territory selling to the same job title in the same industry is usually the same market, and calling it new is par for the course in a planning deck.
- Scoring every idea at the same confidence. If penetration and diversification both read 60%, the gradient is gone and the grid is decoration.
- Ignoring competitors. Wikipedia's criticism section notes the matrix used alone "could be misleading" because it leaves out how rivals respond. Pair it with a competitive analysis template.
- Running it once. The grid belongs in annual business planning and every market evaluation, re-scored as customer feedback and first-quarter results arrive.
Excel, Google Sheets or a whiteboard?
A whiteboard is fine for the first ten minutes: four boxes, a pad of sticky notes, a quick and dirty sort. The spreadsheet earns its place once numbers go on the ideas, because the quadrant and priority columns recalculate and the balance tab updates with every edit. Excel and Google Sheets both handle it; Sheets wins when four people score the same file in one meeting and need to stay on the same page.
Two templates sit either side of this one. A SWOT analysis template comes first, since the strengths column is what separates related from unrelated diversification. A total addressable market template comes after, to size any new market an initiative targets before its revenue estimate goes in the scoring tab.
FAQ
Can you explain the Ansoff matrix in a simple way?
It's a four-box grid that asks two questions about any growth idea: is the product new, and is the market new? The answers put the idea in one of four boxes, from the safest (sell more of what you sell to the buyers you have) to the riskiest (a new product for a new market).
What are the four strategies of Ansoff's matrix?
Market penetration (existing products, existing market), market development (existing products, new market), product development (new products, existing market) and diversification (new products, new market).
Which Ansoff strategy is the riskiest?
Diversification, because it needs a new product and a new market at the same time. Market penetration is the least risky, since the business already knows both.
How do you use the Ansoff matrix?
List each growth initiative, mark its product and market as existing or new, estimate revenue, investment and confidence, then compare risk-adjusted returns and check how the budget splits across the four quadrants.
How does Coca-Cola use the Ansoff matrix?
Coca-Cola doesn't publish one, but its moves map onto it. Share a Coke, which started in Australia in 2011, is market penetration. The $4.9 billion Costa acquisition, closed in January 2019, is diversification into coffee shops, the related kind.
What is the difference between the Ansoff matrix and the BCG matrix?
The Ansoff matrix sorts proposed growth options by product and market newness. The BCG matrix sorts existing products by market growth and relative market share. One plans where to grow; the other decides which current products fund it.
Is the Ansoff matrix still relevant?
It's still taught and still used in annual planning, where it sorts growth options for the current market and new ones alike, though it has critics. A 2018 critique by John Dawes, cited on Wikipedia, argues that a product new to the firm usually means a new market too, which blurs the line between product development and diversification. Treat the grid as a sorting tool and keep the forecasting in the scoring tab.
Bottom line
Reach for the Ansoff matrix template when a business has more growth ideas than budget and needs to see, in one table, which of its different growth strategies it knows how to run. It's a growth strategy filter for business growth plans, and it works best before the budget is set. The scoring tab turns gut feel into risk-adjusted revenue; the balance tab shows if the plan is leaning too hard on one corner of the grid.
It won't tell you how big a new market is, how a competitor will respond, or if the existing business has the strengths to back a move. Those questions belong to a market sizing template, a competitive analysis or a SWOT, and the Ansoff matrix is the step that ranks the answers they produce.