Restaurant failure rate: 17.5% close in year one, 62% within 10 years
 By Jan Suski. I go deep on every review, checking every number against its source and digging up details other coverage misses, a habit from six years of SEO and link building for tech companies. Bylines at Brand24 and Senuto. How the scoring works.
The numbers U.S. restaurant survival and industry data, checked 19 November 2026
Roughly one restaurant in six closes in its first year, the worst year on the average survival curve.
Restaurants survive longer than the average U.S. business in the wider economy at every age from one to ten years.
Industry sales set a record in 2025 while 58% of operators did not report a profit.
POS vendors, lenders and franchise brands cite failure rates in their sales decks. Send the city, the segment or the country and I'll source a version you own.
The restaurant failure rate is far lower than the 90% figure repeated in kitchens and business classes. U.S. Bureau of Labor Statistics data shows 17.5% of food service and accommodation establishments that opened in March 2013 had closed a year later, 44.7% by year five and 61.8% by year ten. That's a slightly better survival record than the average private business.
Below you'll find the BLS survival rate for every year from one to ten, the two academic studies every other article quotes, why their numbers differ, the National Restaurant Association's 2026 figures on sales and profitability, the causes owners report, and the openings and closings counted so far in 2026.
The number matters because lenders, landlords and investors price a restaurant loan or a ten-year lease on how long the business is likely to last. A 90% first-year failure assumption and a 17.5% one lead to different loan terms for the same owner.
It's written for restaurant owners and operators pricing the risk of a first location in a 2026 economy, lenders and landlords sizing a lease, and anyone who has heard that nine in ten restaurants close in their first year. Each number links to the agency, journal or association that published it.
Restaurant survival and closures by year
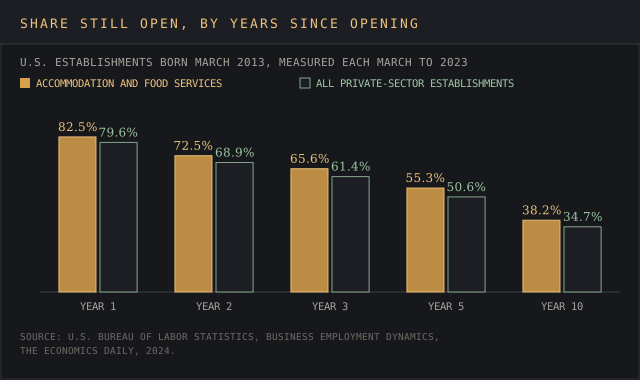
The cleanest national answer comes from the Bureau of Labor Statistics' Business Employment Dynamics program, which tracks every new establishment through state unemployment insurance records. Its 2024 survival analysis follows establishments born in March 2013 for ten years.
Copy these lines into an email, fill them in and send. I reply with scope and a price within 2 to 3 business days.
Open the email| Years open | Accommodation and food services still open | Implied failure rate | All private sector still open |
|---|---|---|---|
| 1 | 82.5% | 17.5% | 79.6% |
| 2 | 72.5% | 27.5% | 68.9% |
| 3 | 65.6% | 34.4% | 61.4% |
| 4 | 60.3% | 39.7% | 55.3% |
| 5 | 55.3% | 44.7% | 50.6% |
| 6 | 51.2% | 48.8% | 46.7% |
| 8 | 42.9% | 57.1% | 39.9% |
| 10 | 38.2% | 61.8% | 34.7% |
The drop is steepest early. Year one takes 17.5 points, year two another 10, and from year six the curve loses about 2 to 5 points a year. A restaurant that reaches its fifth birthday has better odds of reaching its tenth than a new opening has of reaching its fourth.
BLS groups hotels, covered in our hotel market intelligence guide, with eating and drinking places in this category, and it counts an establishment as closed when it stops reporting employees. A sale to a new owner who keeps the staff is a survival in this data.
Why published restaurant closure figures disagree
The 90% claim has no study behind it. Ohio State hospitality professor H.G. Parsa, author of the most cited study on the subject, called it "a myth that is harmful to the restaurant industry" in a 2005 university release.
Parsa's own study, "Why Restaurants Fail" in the August 2005 Cornell Hotel and Restaurant Administration Quarterly, used health department permits for more than 2,439 restaurants in Columbus, Ohio. It found 26.16% of independent restaurants failed in year one and about 60% within three years. Its definition counted an ownership change as a failure, which pushes the rate up.
Tian Luo and Philip Stark of UC Berkeley worked from 1.9 million BLS microdata records covering about 81,000 full-service restaurants in the western U.S. over 20 years. Their paper, "Only the Bad Die Young", put first-year failure for independent full-service startups at 17% and the median lifespan at about 4.5 years, against 19% and 4.25 years for other service businesses.
| Source | Data | First-year failure | Longer horizon |
|---|---|---|---|
| Commonly repeated claim | No dataset | 90% (stated as 90 to 95%) | n/a |
| Parsa et al., 2005 | Columbus, Ohio health permits, 1996 to 1999 | 26.16% | About 60% within 3 years |
| Luo and Stark, 2014 | BLS microdata, 81,000 western U.S. full-service restaurants | 17% | Median life 4.5 years |
| BLS Business Employment Dynamics | All U.S. accommodation and food services, 2013 cohort | 17.5% | 61.8% within 10 years |
- The segments, regions or cost lines to compare
- Regions, years and segments
- Where it runs: blog, white-label, gated or lead magnet
- Whose byline goes on it
- Deadline
- 2,500+ words, human-written
- Every figure linked to its source
- Yours to publish, under your name or none
- Hosting here for +$200, with your sponsored links
Three things move the figure: what counts as a restaurant, what counts as failure, and which city or decade is sampled. Payroll-record data like the BLS series lands at about 45% over five years, and definitions that count an ownership change as a failure, like Parsa's, push the number higher.
What the averages mean for a new restaurant
An average restaurant opening has a 55.3% chance of reaching year five, using the BLS table above, and a median life of about 4.5 years in the Luo and Stark data, so the average closure comes years after opening day. A lease signed for ten years outlasts the median restaurant by more than five years, so the term of the lease belongs in the failure math as much as the menus and table count do.
These averages hide wide spreads by market. A table-service restaurant in a dense downtown market faces different rent, wages and competition from a drive-thru on a highway exit, and the restaurant industry statistics above don't split by format. Parsa's Columbus study found restaurant density and ownership turnover correlated at 0.9919, so crowded markets churn faster.
Owners can use these restaurant statistics in three ways:
- Budget for the first two years, when 27.5% of new establishments close in the BLS data.
- Price menus against the 28% to 35% food cost range ReFED cites, and against local wages.
- Track consumer trends in their own market, since the national averages arrive a year or more after the market moves.
Restaurants compared with other businesses
Restaurants fail less often than the national average. In the BLS 2013 cohort, 34.7% of all private-sector establishments survived ten years, against 38.2% in accommodation and food services. Our small business statistics cover failure rates for firms of every size, and our entrepreneur statistics track survival for founders in general.
Small restaurants carry more risk. Luo and Stark found a median lifespan of 3.75 years for restaurants with five or fewer employees, slightly below the 4.0 years for service businesses of the same size. The National Restaurant Association's national statistics say 7 in 10 restaurants are single-unit operations and 9 in 10 have fewer than 50 employees.
Full service restaurants, fast food and chains
Parsa's Columbus data showed three-year failure of 57.2% for franchise chains and 61.4% for independent operators, a gap of about four points.
The openings and closings tallied for 2026 point the same way. Bank of America's State of the Restaurant Industry 2026, published 15 October 2026, counted 9,541 openings and 8,171 closings in the first half of the year. Chain outlets made up 4,253 of the closings and independents 3,918, while about 61% of the openings came from independent operators.
- Full-service restaurant employment was 165,000 jobs below its pre-pandemic level in October 2026, per the National Restaurant Association.
- Only 29% of limited service operators expected higher sales in 2026, with full service operators more optimistic, C-Store Dive reported from the NRA survey.
- Limited-service restaurants, the fast food and quick service segment, took the largest share of food away from home spending from 2019 to 2023, according to the USDA Economic Research Service.
Value menus are the fast food response to that pressure. Chains with national advertising budgets can fund them across thousands of units, while a single-unit full service operator facing the same menu prices problem has one location's cash to work with.
Restaurant industry statistics 2026
The foodservice industry keeps growing while individual restaurants close. The National Restaurant Association's 2026 State of the Restaurant Industry report projects restaurant and foodservice industry sales of $1.55 trillion in 2026 and real growth of 1.3%, with employment reaching 15.8 million jobs.
The National Restaurant Association projects restaurant and foodservice industry sales of $1.55 trillion in 2026, with real growth of 1.3%.
Projected U.S. restaurant and foodservice sales in 2026
Source: National Restaurant Associatione.g. survival or profit rates for your segment
Source: linked, checked, dated| Measure | Value | Source |
|---|---|---|
| Restaurant and foodservice sales, 2026 projection | $1.55 trillion | National Restaurant Association |
| Restaurant and foodservice sales, 2025 | $1.4 trillion | National Restaurant Association |
| Food services and drinking places payroll jobs, October 2026 | 12,383,700 | Bureau of Labor Statistics |
| Food away from home spending, 2024 | $1.52 trillion | USDA Economic Research Service |
| Food away from home share of food spending, 2024 | 58.9% | USDA Economic Research Service |
| Operators profitable in 2025 | 42% | National Restaurant Association |
Payroll employment at eating and drinking places, the core of the industry, was 12,383,700 in October 2026, down 7,200 from September, according to the BLS Employment Situation as summarized by Nation's Restaurant News. The industry still had 57,200 more employees on payroll than a year earlier.
Restaurant spending holds up because consumers and diners keep eating out, and food away from home spending has outpaced food at home since 2004, per the ERS. The USDA ERS food expenditure series shows food away from home spending climbed from $1.45 trillion in 2023 to $1.52 trillion in 2024, a record 58.9% of total food spending. Bank of America Institute data shows restaurant card spending up 3.3% year over year through July 2026.
Economic impact of the restaurant and foodservice industry
The restaurant and foodservice industry is the second-largest private employer in the U.S. economy, per the NRA. Its economic impact figures put direct output at $1.4 trillion, about 6% of real GDP, and direct employment at 14.2 million employees in 2022. Counting suppliers and the spending of restaurant employees, total output reaches $3.5 trillion and 22.9 million jobs.
- Eating and drinking places account for nearly $1.2 trillion of the $1.55 trillion in expected 2026 restaurant sales, with other eating places such as cafeterias, hotels and stadiums making up the rest of the foodservice market.
- Nearly three quarters of operators plan to hire in 2026, and more than 75% said they were likely to add staff, in a labor market our job search statistics describe from the applicant side.
- 63% of U.S. adults have worked in the restaurant industry at some point, often as a first job of the kind our Gen Z statistics track, and 8 in 10 restaurant owners started in entry-level jobs.
- 41% of restaurant companies are minority-owned, against 30% of businesses in the overall private sector.
Those restaurant statistics explain how sales set records in a year with 8,171 closings in six months. Openings outnumbered closings by 1,370 over the same period, and diners kept spending.
Consumer demand and dining trends
Consumers keep spending on meals out, but they spend with more care. In the past year, Bank of America data shows restaurant spending on its cards up 3.3% through July 2026, with lower-income households up 4.1%, and its report notes 61% of consumers say restaurants remain an essential part of their lifestyle.
Inflation-adjusted figures tell a slower story for the industry, and consumers count every dollar. The USDA ERS shows real food away from home spending of $1.41 trillion in 2025 and a 56.3% share of total food spending, while the share of disposable income diners spent on food away from home stood at 5.5% in 2024.
Menus are changing to match consumer trends, and diners now judge value on drinks as well as food. Beverage and snack sales rose 5.9% in the first five months of 2026, and younger consumers are 40% more likely than older ones to buy drinks away from home, Bank of America reports. Takeout, delivery and drive-thru already take the larger share of visits, 75%, which favors restaurant operators with small dining rooms and strong online ordering.
In recent years, menu prices have carried restaurant sales growth. Operators raised prices again in 2025, and the NRA expects only 1.3% real growth in 2026. Wages are the other side of that equation, and the staff turnover side is covered in our employee engagement statistics. Labor costs rose 3.6% in the year to July 2026 on a payroll of 12.4 million employees at eating and drinking places, and the expected 2026 job gains come on top of it.
Costs, wages and profit margins
Operators across the foodservice industry cite costs before demand. Restaurant Business reported that only 42% of operators told the National Restaurant Association they were profitable in 2025, a year of record $1.4 trillion in sales lifted by menu price increases.
- Labor costs rose 3.6% in the year to July 2026, per BLS data cited by Bank of America.
- Full-service waitstaff wages run from $19.00 an hour at the lower quartile to $41.50 at the upper, with a median of $27.00, per the NRA.
- The federal cash wage for tipped employees is $2.13 an hour under the Fair Labor Standards Act, per the Department of Labor, though many states require more.
- Food costs run 28% to 35% of sales in restaurants, according to ReFED.
Food and labor costs together are the prime cost, and cost control on that line decides most outcomes for the average restaurant, whatever the menus or the market. That 3.6% labor increase compares with real sales growth of 1.3% expected for 2026, so sales records and closures arrive in the same year.
Why restaurants fail
Money and owner fatigue both show up in the research. Parsa's interviews in Columbus found many failed owners cited family issues such as divorce, poor health or a wish to retire, and every one mentioned the hours a restaurant demands. Poor financial management shows up too. In Parsa's interviews, some owners who closed didn't track their daily costs at all, the kind of operational inefficiency that back-office cost control systems now target.
Consumer demand is shifting under existing restaurants too, and industry trends now run through takeout counters and drive-thru lanes. Takeout, delivery and drive-thru account for 75% of restaurant traffic, per NRA data cited by Bank of America. FTI Consulting estimates GLP-1 weight-loss drugs could mean 3 billion fewer restaurant-equivalent meals a year by 2030. A dining room built for 2019 traffic serves a smaller share of customers and diners now.
Economic conditions matter at the margin. BLS research shows one-year survival rates for new establishments were lowest for those born in 2001 and 2008, both recession years. Readers tracking the consumer side can compare our retail industry statistics and coffee statistics, two categories competing for the same discretionary food dollars.
Restaurant technology, food waste and cost control
Restaurant technology spending covers the back office and the dining room. POS systems feed sales data into inventory and scheduling, online ordering and loyalty programs handle marketing and bring takeout customers back, and integrated systems link the two. Our customer service statistics and AI adoption statistics show how far automation has spread outside food service.
Food waste is a cost restaurant owners can measure line by line. ReFED estimates restaurants and foodservice businesses generated 12.5 million tons of surplus food in 2024, with plate waste 69.6% of it and 9.73 million tons sent to landfill. Reducing food waste through tracking and analytics would add $620 million a year in profit potential for restaurants, ReFED estimates.
Food delivery spending grew tenfold in 27 years. American Farm Bureau analysis of ERS data shows food delivery spending rose from $9.8 billion in 1997 to $100.5 billion in 2024.
Restaurant closures outside the U.S.
The UK foodservice industry has the most complete public count. The Insolvency Service recorded 3,353 accommodation and food service insolvencies in 2025, down 3.3% from 3,465 in 2024, as Harpers reported from the government release.
By rate, the sector is the worst in the UK. The Insolvency Service's business insolvency demography put accommodation and food services at 268 insolvencies per 10,000 businesses in 2025, the highest of any sector every year since 2015. Insolvency counts only formal failures, so UK closures overall run higher.
Delivered for your site and your byline. Hosting here is optional.
Frequently asked questions
What is the average failure rate of restaurants?
About 17.5% close in the first year and 44.7% within five years, based on the BLS 2013 cohort for accommodation and food services. Luo and Stark put first-year failure for independent full-service restaurants at 17%.
How many restaurants end up failing?
About 62% of restaurants that open close within ten years, per BLS data. That's below the 65.3% for all private-sector establishments.
Why do 90 percent of restaurants fail?
Published studies put first-year failure between 17% and 26%, well under 90%. The highest rate in the research, Parsa's Columbus data, is about 60% over three years with ownership changes counted as failures.
What are the 3 most common reasons why restaurants fail?
The research points to thin margins and rising costs, poor cost tracking by owners, and personal reasons such as burnout, health or retirement. Location, local market competition and the wages employees can get elsewhere shape all three.
Is the restaurant industry slowing down?
Industry sales are still growing, to a projected $1.55 trillion in 2026, but real growth is 1.3% and jobs fell by 7,200 in October 2026. Closings ran at 8,171 in the first half of 2026 against 9,541 openings. Consumers and diners are still spending, with restaurant card spending up 3.3% through July 2026, and full-service dining employment remains 165,000 jobs below its pre-pandemic level.
What is the 30/30/30/10 rule for restaurants?
A budgeting rule of thumb that splits sales into 30% food costs, 30% labor and wages, 30% overhead and 10% profit. Operators use it to price menus and judge value deals. With only 42% of operators profitable in 2025, many restaurants never reach the last 10%.
Bottom line
Restaurants close at about 17.5% in year one and 61.8% over ten years in BLS data, better than the U.S. business average. Every published dataset puts the ten-year rate below the 90% that folklore assigns to year one.
Only 42% of operators reported a profit for 2025 while industry sales hit records, and Parsa's interviews with owners who closed point at cash flow and the hours the job demands.
POS vendors, food suppliers and franchise consultants use reports like this one in sales decks and client briefs.
A report on your topic for a blog page, gated content or a lead magnet.
Written for your client and published under their brand, with my name left off.
Your report on marketintelligencetools.com, with 2 to 3 CTAs carrying your sponsored links.
Default terms: the report is yours to publish, and I keep the right to republish it on this site behind a gate, outside Google's index.
The agencies, studies and trade bodies behind each restaurant figure, and the closure count nobody keeps
Government data: bls.gov (Business Employment Dynamics survival analysis for the 2013 cohort, 2024; 1-year survival rates by year and location, 4 March 2024; Employment Situation for October 2026, 6 November 2026), ers.usda.gov (Food Expenditure Series and Charts of Note, 2024 and 2025 data), dol.gov (Fact Sheet 15, tipped employees) and gov.uk (Business Insolvency Demography 2015 to 2025, 19 June 2026).
Studies: arxiv.org (Luo and Stark, "Only the Bad Die Young", October 2014), econ.ucsb.edu (Parsa et al., "Why Restaurants Fail", Cornell Hotel and Restaurant Administration Quarterly, August 2005) and news.osu.edu (Ohio State release on the Parsa study).
Trade bodies, banks and press: restaurant.org (2026 State of the Restaurant Industry release, 12 February 2026; national statistics; restaurant jobs indicator, 6 November 2026), business.bofa.com (State of the Restaurant Industry 2026, 15 October 2026), restaurantbusinessonline.com, cstoredive.com, nrn.com, refed.org, fb.org and harpers.co.uk.
All figures checked 19 November 2026. No U.S. agency publishes a survival rate for restaurants alone, so the BLS series groups them with hotels, and the National Restaurant Association publishes no national closure count.