Job search stats 2026: 62.6 applications, 6.6 months and one interview per six applications
 By Jan Suski. I go deep on every review, checking every number against its source and digging up details other coverage misses, a habit from six years of SEO and link building for tech companies. Bylines at Brand24 and Senuto. How the scoring works.
The average US job search in 2026 takes 28.5 weeks and 62.6 applications, according to a United Way of the National Capital Area survey of 1,000 recent and current job seekers fielded from February 26 to March 7, 2026. On average, 67% of those applications got no response.
The official data shows why job hunting feels slow. The Bureau of Labor Statistics counted 7.5 million job openings in September 2026 and 7.1 million unemployed people in October, and 1.96 million of them had been looking for 27 weeks or longer.
This report collects the latest job search statistics from sources that publish a sample and a method: the BLS Employment Situation report, the Job Openings and Labor Turnover Survey, the New York Fed, NACE, iHire, LinkedIn, Robert Half, GMAC, the World Economic Forum and the Pew Research Center. Every figure carries its publisher and date.
It's written for job seekers planning a search, for recruiters and hiring managers benchmarking their hiring process, and for anyone tracking the US job market. The figures matter because they set realistic expectations: how many applications, how many weeks and which channels lead to job offers.
The numbers US job search and hiring, checked 17 November 2026
Openings and unemployed people sit near parity, at about 1.06 openings per unemployed person, yet hires come slowly: the hires rate was 3.4% in September.
Volume is the job seeker's main tool, and it has limits: BLS data shows an interview for every six job applications, and offer odds drop after 80 applications.
Connections and skills shape who gets hired: LinkedIn applicants connected to employees at a company are 3.6 times as likely to be hired, and 70% of employers screen on skills.
I'll write a 2,500+ word report on the labor market you name, with BLS, JOLTS and survey figures linked to their sources like this page. Yours to publish, from $200.
Job market in 2026: unemployment, openings and hires
Unemployment stood at 4.1% in October 2026, down from 4.2% in September, according to the BLS Employment Situation report. Total nonfarm payroll employment rose by 165,000, and 7,068,000 people were unemployed.
Companies added jobs in four industries. Professional and business services added 70,000 jobs, health care 42,000, transportation and warehousing 25,000 and manufacturing 19,000. Average hourly earnings reached $38.00, up 3.1% from $36.85 a year earlier.
The Job Openings and Labor Turnover Survey is the Bureau of Labor Statistics count of how many jobs are open and how many hires employers make each month. Its figures cover total nonfarm employment, public and private. The September 2026 release, seasonally adjusted:
| Measure | Level | Rate | Change from August |
|---|---|---|---|
| Job openings | 7,523,000 | 4.5% | +333,000 |
| Hires | 5,402,000 | 3.4% | +131,000 |
| Total separations | 5,319,000 | 3.3% | +144,000 |
| Quits | 3,365,000 | 2.1% | +321,000 |
| Layoffs and discharges | 1,641,000 | 1.0% | -127,000 |
Job openings, hires and separations, September 2026 (seasonally adjusted)
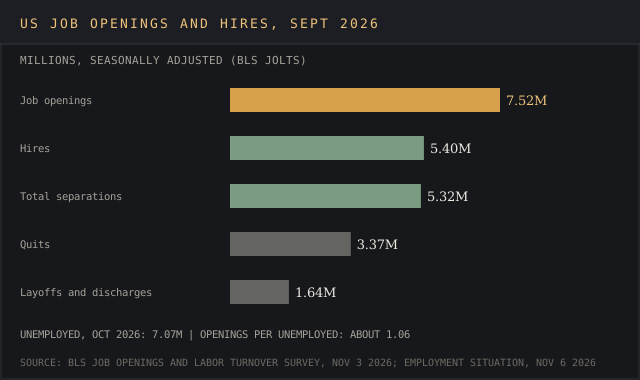
Set side by side, the two releases put 7.5 million openings against 7.1 million unemployed people. That's about 1.06 openings per person looking.
The gap between 7.5 million openings and 5.4 million hires is the slow part. Quits rose by 321,000 to 3.37 million, while layoffs fell to 1.64 million. Layoffs in health care and social assistance dropped by 70,000 employees, and accommodation and food services added 158,000 hires. Health care and social assistance also runs a 3.8% absence rate, above the 3.2% national average, per our absenteeism rate benchmarks.
Hires in 2026: how fast companies fill positions
Companies made 5.4 million hires in September 2026, a hires rate of 3.4%, up 131,000 from August. Accommodation and food services posted the largest jump, with 158,000 more hires. Job openings outnumbered hires by 2.1 million that month.
LinkedIn's data shows the same slowdown in new hires. The LinkedIn Workforce Report for August 2026 put the LinkedIn hiring rate, which counts members who add a new employer to their profile, 8% below its January level and 26% below its February 2020 pace.
Fewer hires spread over a bigger pool of applicants. LinkedIn CEO Dan Shapero told Fortune in September 2026 that recruiters now dig through hundreds or thousands of applicants for open positions. For job seekers, finding the right new job is a needle in a haystack from the other end.
Salaries and pay in the job search
Pay drives the job search on both sides. Average hourly earnings for private-sector employees reached $38.00 in October 2026, up 3.1% from $36.85 a year earlier. Salaries rising at that pace still leave room to move: 3.37 million employees quit in September.
Salaries are also the top reason job offers fail. In the BLS 2018 data, 23.24% of job seekers who turned down an offer said the wage was too low. For new graduates starting a career, NACE reports that the gap between bachelor's and master's starting salaries is narrowing among top majors.
How long does a job search take?
The United Way survey puts the average time to find a job at 28.5 weeks, about 6.6 months. Laid-off candidates took 6.5 months. Industry made the widest gap in the data: tech job seekers searched for 9.7 months, while construction, manufacturing and hospitality searches ran 3.7 to 4.2 months.
BLS duration data tells the same story with a twist. In October 2026, the mean spell of unemployment lasted 27.1 weeks and the median 11.9 weeks. The median is the better guide to a typical search, because 1.96 million long-term unemployed people pull the mean up.
| Time looking | Unemployed |
|---|---|
| Less than 5 weeks | 2,170,000 |
| 5 to 14 weeks | 1,737,000 |
| 15 to 26 weeks | 1,242,000 |
| 27 weeks and over | 1,963,000 |
Copy these lines into an email, fill them in and send. I reply with scope and a price within 2 to 3 business days.
Open the emailUnemployed people by length of search, October 2026 (seasonally adjusted)
The Bureau of Labor Statistics publishes these figures in the first week of each month, so the next update lands in early December. Each release also revises the total nonfarm employment count for the two prior months.
How many applications does it take to get a job?
Candidates in the United Way survey sent 62.6 applications each, at about 44 minutes per application, for 46.2 hours in total. Laid-off respondents sent 95.3. Tech candidates sent 103.7 and spent 69.9 hours on job applications, while healthcare candidates sent 41.6.
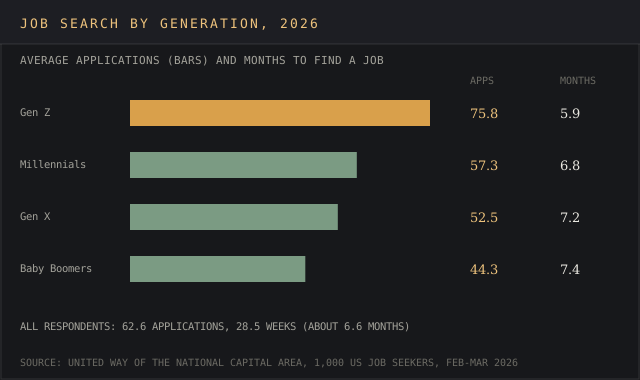
The generational split runs in opposite directions. Gen Z candidates sent 75.8 applications and found work in 5.9 months; baby boomers sent 44.3 and needed 7.4 months.
The BLS measured the return on each application in a Current Population Survey supplement from May and September 2018. Unemployed job applicants sent 13.67 applications over two months and landed 1.93 interviews. That works out to roughly one interview for every six applications.
| Applications sent | Received a job offer |
|---|---|
| 0 | 13.21% |
| 1 to 10 | 27.20% |
| 11 to 20 | 29.48% |
| 21 to 80 | 30.89% |
| 81 or more | 20.36% |
| All job seekers | 26.24% |
Chance of a job offer by number of applications (BLS, 2018)
Offer odds peak in the 21 to 80 range and fall after it. Candidates who had searched 27 weeks or more got offers 18.44% of the time, against 30.94% for those under five weeks, so a search that drags on can turn into a vicious cycle.
Job interviews and job offers
An interview is the gate that matters, and landing one is easier said than done. In the BLS data, 36.89% of job seekers who got an interview also got an offer, against 9.94% of those with none.
United Way candidates averaged about 4.76 job interviews per search. Close but no cigar was a common outcome: 43.6% reached the final interview stage and were still rejected, and 35.1% were asked to complete unpaid assessments or projects meant to preview job performance.
Job offers also get turned down. Among the BLS respondents who declined one, the reasons ran:
- Wage too low: 23.24%
- Personal reasons: 13.25%
- Inconvenient hours: 12.13%
- Commute too long: 10.97%
- Schedule not flexible enough: 6.96%
- Too few hours: 6.51%
- Outside their usual occupation or skills: 6.04%
Holding out for better pay tops the list by 10 points. Benefits, at 1.48%, barely registered.
Hiring managers and the hiring process
Hiring managers say the hiring process behind new hires keeps getting longer. A Robert Half survey of more than 2,000 US hiring managers, run in November 2025, found 67% of HR leaders say AI-generated applications have slowed the hiring process, and 20% report delays of over two weeks.
A year earlier, 93% of the roughly 2,200 hiring managers the firm surveyed said hires took longer to close than two years before. The devil's in the details: evaluating applications (51%), checking references or running background checks (47%) and scheduling interviews (43%) were the steps that slowed.
Application volumes top the list of hiring challenges employers name. In iHire's State of Online Recruiting 2026, which surveyed 1,054 job seekers and 318 employers in July and August 2026, 55.7% of employers said they get too many unqualified job candidates, and 32.7% said they get too few. Another 23.6% received at least one fake or fraudulent applicant.
Recruiters move fast through that pile of candidates' resumes. The 2018 Ladders eye-tracking study clocked the time recruiters spend on an initial resume screen at 7.4 seconds, up from 6 seconds in 2012, and that study is the source of the "7-second rule" for resumes. Recruiters looked longest at job titles, and cluttered resumes with long sentences and multiple columns scored worst.
Job board use and employee referrals
The job board still gets the lion's share of searches. iHire found 82.1% of job seekers use general job boards, and 81.7% of employers recruit on them. For 68.8% of companies, job board hires make up all or most of their hires, and 39.2% leaned on job boards more in the past year.
Employee referrals are the second channel. Some 67.0% of companies use referrals from current employees to find candidates, while 30.5% of job seekers find opportunities through referrals or word of mouth.
The payoff from a connection is large. LinkedIn reported in January 2026 that applicants are 3.6 times as likely to be hired if they're connected to an employee at the company. For recruiters, referral hires come with a built-in check: employees who already know the candidate.
The widely repeated claim that 85% of jobs are filled through networking traces to a 2016 LinkedIn post by recruiting consultant Lou Adler, based on a self-selected sample of about 3,000 mostly management-level professionals. LinkedIn also reported that 70% of professionals hired in 2016 had a connection at the company of their new job. Treat both as the top of the range; the 2026 measured share of job seekers finding work through referrals is 30.5%.
Fake job postings and AI tools in the job search
Scam postings turn part of every search into a wild goose chase. iHire found 41.2% of job seekers ran into a fake or scam job in the past year, 42.8% find it hard to tell if an employer is legitimate, and 39.3% name fake or ghost jobs among their biggest frustrations.
AI tools now sit on both sides of the application process:
| Measure | Share |
|---|---|
| Employers using AI in recruiting, 2026 | 24.2% (25.9% in 2025, 14.7% in 2024, 4.9% in 2023) |
| Employers using AI to write job ads | 66.2% of AI users |
| Employers using AI to screen or filter resumes | 29.9% of AI users |
| Job seekers using AI platforms such as ChatGPT to find jobs | 11.1% (6.3% in 2025) |
| Job seekers using AI to write resumes or cover letters | 32.4% |
| Job seekers who view employers' AI use negatively | 44.3% |
- The role, industry or market to cover
- Regions, years and segments
- Where it runs: blog, white-label, gated or lead magnet
- Whose byline goes on it
- Deadline
- 2,500+ words, human-written
- Every figure linked to its source
- Yours to publish, under your name or none
- Hosting here for +$200, with your sponsored links
AI use in hiring, employers and job seekers (iHire)
AI-written resumes and cover letters feed the volume problem hiring managers describe. The worry runs wider than hiring. A Pew Research Center survey of 3,488 US adults in June 2026 found 71% expect AI to lead to fewer jobs in the US over the next 20 years.
Skills-based hiring: what employers expect
Skills based hiring is now the default at most employers, and companies hunting top talent screen on it first. NACE's Job Outlook 2026 found 70% of employers use it, up from 65% the year before, and 71% of those use it for at least half their hires.
The GMAC 2026 Corporate Recruiters Survey of 621 recruiters in 39 countries ranks communication, problem-solving and adaptability as the most important factors in hires of business graduates. Those soft skills, the ones employers want in employees, sit next to hard skills that rose fast: data analysis jumped from 10th to 4th place in one year, and AI skills grew in importance faster than any other capability.
Employers expect the skills mix to keep moving. The World Economic Forum's Future of Jobs Report 2025 projects that 39% of workers' core skills will change by 2030, with 170 million jobs created and 92 million displaced worldwide.
Entry level and Gen Z job search statistics
Entry level candidates start their career search at a higher unemployment rate than the job market as a whole, and the challenges start with the first job.
The New York Fed's economic research team reported recent college graduate unemployment of 5.2% in its November 2026 update, with 42.5% of recent graduates working in jobs that typically don't require a degree. In the first quarter of 2026, the rate was 5.7%. At 5.2% against 4.1% for all workers, the market for first jobs is dog eat dog.
Technical roles offer no shelter for early-career candidates. The New York Fed's table by major lists computer science graduates at 7.0% unemployment and computer engineering graduates at 7.8%.
AI is part of the reason Gen Z is struggling. GMAC found one in three companies has replaced at least some entry-level roles with AI. NACE's numbers are brighter for the class of 2026: employers planned 5.6% more hires of new graduates, and over 40% of graduates had a job offer before graduation day. The Gen Z statistics report covers the generation's spending, career and work habits in more detail.
Long-term unemployment and men out of work
Long-term unemployment is where a search can leave job seekers back to square one. In October 2026, 1,963,000 people had been unemployed for 27 weeks or more, 27.6% of all unemployed. Another 4.84 million employees worked part time for economic reasons, up 339,000 in a month, and 448,000 were discouraged workers. The broad U-6 underutilization rate was 7.9%.
In October 2026, 1,963,000 people had been unemployed for 27 weeks or more, 27.6% of all unemployed, per the BLS.
Unemployed people looking 27 weeks or longer, October 2026
Source: BLSe.g. hiring times for nurses in Texas
Source: linked, checked, datedThe "1 in 3 men not working" figure checks out by headcount. The employment-population ratio for men 16 and over was 64.5% in October 2026, so 35.5% of men weren't employed. For men 20 and over the ratio was 66.9%. Most of that group is outside the labor force, including retirees and students; the unemployment rate for men 16 and over was 4.3%.
Candidate experience and the cost of a long search
The candidate experience complaint behind these numbers is poor communication. In the United Way survey, 94.3% of respondents applied to jobs and never heard back. Some 67% said job searching feels like a full-time job, and nearly 80% felt burned out, rising to 83% among laid-off respondents.
A long application process costs companies too: iHire found 41.3% of job seekers would skip an application that takes longer than 10 minutes. Companies competing for top talent lose candidates at that step. Long forms are a candidate experience cost: each skipped form shrinks the pool of job applicants.
A long search also puts households against the clock. Of the United Way respondents:
- 45% said savings would run out in under a month without income
- 16% could cover six months or more
- 55.6% used up savings during the search
- 42.6% borrowed from family or friends
- 54.8% of non-employed respondents did gig or freelance work to make ends meet
That last figure links job hunting to the freelance economy covered in the freelance statistics report. For candidates who want to work remotely, the remote work statistics report tracks how many employees work remotely, how remote roles and remote jobs get filled, and where remote work is growing. Counted six ways, gig work runs from 4% to 38% of US workers, per our gig economy statistics.
Delivered for your site and your byline. Hosting here is optional.
Frequently asked questions
Why is it so hard to find a job in 2026?
Hires are slow. Companies made 5.4 million hires in September 2026 against 7.5 million job openings, Robert Half found 67% of HR leaders say AI-generated applications slow review, and 55.7% of employers in iHire's survey get too many unqualified applicants.
Is it true that 70% of jobs are found through networking?
The 85% figure comes from a 2016 LinkedIn post by Lou Adler with a self-selected sample, and the 70% figure from a 2016 LinkedIn count of hires who had a connection at their new company. In iHire's 2026 data, 30.5% of job seekers found opportunities through referrals or word of mouth, and LinkedIn reports connected applicants are 3.6 times as likely to be hired.
Are 1 in 3 men not working?
Yes, by headcount: the employment-population ratio for men 16 and over was 64.5% in October 2026, so 35.5% weren't employed. Most were outside the labor force; men's unemployment rate was 4.3%.
Why is Gen Z struggling to find jobs?
Gen Z's challenges start with thin entry-level hires. Recent graduate unemployment was 5.2% in the New York Fed's November 2026 update, and one in three companies in GMAC's survey replaced some entry-level roles with AI. Gen Z sends the most applications, 75.8 per search.
What percentage of interviews lead to a job offer?
In BLS data, 36.89% of job seekers who landed an interview received an offer, against 9.94% of those who didn't. Across all job candidates, 26.24% got an offer.
What is the 7-second rule for resumes?
It comes from Ladders' 2018 eye-tracking study, which found recruiters spend 7.4 seconds on the first screen of candidates' resumes.
How do people find jobs?
Mostly through job boards: 82.1% of job seekers use general job boards, per iHire. Referrals and word of mouth reach 30.5%, and 67.0% of companies use referral hires from current employees.
Bottom line
The 2026 job search is a volume game with low returns per try. The average search runs 28.5 weeks and 62.6 applications, one in six applications produces an interview, and 67% of applications go unanswered.
These job search statistics point to three levers: an interview nearly quadruples offer odds, a connection inside the company makes a hire 3.6 times as likely, and 70% of employers use skills based hiring. Keep an eye on the next JOLTS release in early December, which will show if the September jump in openings turns into hires and filled positions.
Job boards, staffing firms and HR software vendors publish reports like this one as lead magnets and client briefs.
A report on your topic for a blog page, gated content or a lead magnet.
Written for your client and published under their brand, with my name left off.
Your report on marketintelligencetools.com, with 2 to 3 CTAs carrying your sponsored links.
Default terms: the report is yours to publish, and I keep the right to republish it on this site behind a gate, outside Google's index.
Where each job search figure comes from, and what no survey publishes
Labor market figures come from the BLS Employment Situation report for October 2026 (released 6 November 2026), the JOLTS release for September 2026 (3 November 2026) and the BLS Beyond the Numbers article on its 2018 Current Population Survey supplement. Recent graduate figures are the New York Fed's, from its November 2026 update.
Survey figures come from United Way of the National Capital Area (1,000 job seekers, fielded 26 February to 7 March 2026), iHire's State of Online Recruiting 2026 (1,054 job seekers and 318 employers, July and August 2026), NACE's Job Outlook 2026 and GMAC's 2026 Corporate Recruiters Survey (621 recruiters).
Hiring and AI figures come from Robert Half's November 2025 survey, LinkedIn's Workforce Report for August 2026, the Pew Research Center (3,488 adults, June 2026) and the World Economic Forum's Future of Jobs Report 2025. All were checked on 17 November 2026.
No public source counts how many applications a typical US job posting receives, or the share of jobs filled without a public posting.