Absenteeism rate 2026: US full-time workers averaged 3.2% absent in 2025
 By Jan Suski. I go deep on every review, checking every number against its source and digging up details other coverage misses, a habit from six years of SEO and link building for tech companies. Bylines at Brand24 and Senuto. How the scoring works.
The numbers US and UK workplace absence, checked 20 November 2026
Illness or injury accounts for 2.2 points of the 3.2% US absence rate, so poor health drives about two-thirds of recorded absence.
The public sector runs at 4.2% against 3.0% in the private sector, so a single national benchmark misleads anyone outside the middle.
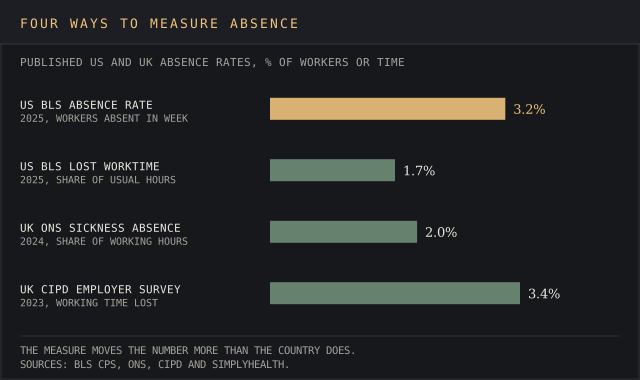
The US lost 1.7% of hours and the UK lost 2.0% on different survey designs, so cross-country gaps under half a point are noise.
HR software vendors, benefits brokers and consultants quote absence benchmarks in every pitch. Send the sector or the country and I'll source a version you own.
3.2% of full-time US wage and salary workers were absent from work in an average week of 2025, and together they lost 1.7% of the hours they usually work. Both figures come from the Bureau of Labor Statistics' Current Population Survey, Table 47, which covers 121.3 million full-time workers. The 2025 average runs 0.4 points above 2019's 2.8% and 0.4 points below the 3.6% peak in 2022.
This page sets out the absenteeism rate formula, three worked absenteeism rate calculation examples, the average absenteeism rate by industry, occupation, age and sex, the UK comparison, what absence costs an employer, and what a good rate looks like. Every benchmark links to the body that published it, straight from the horse's mouth.
It's written for HR managers who need a benchmark for a board pack, for operations leads checking a team's absenteeism rate against an industry average, and for analysts who have to interpret HR data from two countries that measure absence differently. The stakes are concrete: one percentage point of absence on a 500-person, 250-day payroll is 1,250 lost workdays a year, our own arithmetic.
What the absenteeism rate measures
The absenteeism rate measures how much scheduled work time is lost to absence, as a percentage. A 10% rate means 10% of scheduled time went unworked. Most employers count only unplanned absence: sick days, personal emergencies, no-shows and the occasional unauthorized absence. Planned vacation and approved leave sit outside it.
The BLS publishes two measures, and they answer different questions:
- Absence rate: full-time workers who were absent part of the reference week, as a share of all full-time wage and salary workers. 3.2% in 2025.
- Lost worktime rate: hours absent as a share of hours usually worked. 1.7% in 2025, the figure behind the common claim that US employers lose about 1.7% of scheduled work time.
Both count absence for illness or injury, child care problems, family or personal obligations, civic duty and maternity or paternity leave. Vacation is excluded. That's why the BLS absence rate splits into 2.2 points of illness or injury and 1.0 point of other reasons.
The UK uses a third measure. The ONS reports the share of working hours lost to sickness or injury, and the WHO Europe health indicator counts working days lost per employee per year from sick-leave registers. Before comparing a company's absenteeism rate with any benchmark, check which of the three it matches.
Absenteeism rate formula: how to calculate absenteeism rate
The absenteeism rate formula is the same whatever the period:
Absenteeism rate = (days of unplanned absence / available workdays) × 100
Available workdays are the number of employees multiplied by the scheduled workdays in the same period. When calculating absence for part-time or shift staff, use hours in place of days, as long as both numerator and denominator use the same unit. The result is an absence percentage you can compare month to month, and the quickest way to gauge workforce health across a large organization.
Absenteeism rate calculation examples
Three worked cases, using our own round numbers to show the same formula at different scales:
| Scope | Employees | Workdays | Available days | Days absent | Absenteeism rate |
|---|---|---|---|---|---|
| Team, one month | 10 | 21 | 210 | 7 | 3.3% |
| Department, one quarter | 40 | 63 | 2,520 | 60 | 2.4% |
| Organization, one year | 500 | 250 | 125,000 | 4,000 | 3.2% |
Copy these lines into an email, fill them in and send. I reply with scope and a price within 2 to 3 business days.
Open the emailThe team's absenteeism rate looks high at 3.3%, but it rests on seven days. One person with a week of flu moves a small team's monthly absenteeism rate by more than two points, and a small team's spike can make a mountain out of a molehill. Read any monthly figure for a team under 20 people alongside a rolling 12-month view. The organization's annual absenteeism rate of 3.2% lands on the 2025 US average.
Free absenteeism rate calculator
It's not rocket science: a free absenteeism rate calculator needs three inputs and one line of arithmetic. In a spreadsheet, put headcount in A2, scheduled workdays in the period in B2 and absence days in C2, then enter =C2/(A2*B2)*100. The same formula gives the monthly absenteeism rate, the quarterly figure or the employee absenteeism rate for one person (set A2 to 1).
For a single employee, five days absent across 260 scheduled workdays is 1.9%. That's how to answer "Is 5 absences in a year bad?" with a number.
Average absenteeism rate in the US
The average absenteeism rate in the US rose from 2.8% in 2019 to 3.6% in 2022, then eased to 3.2% in 2025, on BLS annual averages for full-time wage and salary workers. Lost worktime moved from 1.4% to 2.1% and back to 1.7% between those years.
The BLS demographic table for 2025 shows where absence patterns rise:
- Sex: women 4.0%, men 2.6%. Women's rate for other reasons, 1.4%, doubles men's 0.7%, which tracks child care and family obligations.
- Age: 4.2% for workers aged 16 to 19, 2.7% for 20 to 24, 3.2% for 25 to 54 and 3.5% for 55 and over.
- Race and ethnicity: White 3.2%, Black 3.3%, Asian 2.8%, Hispanic or Latino 2.9%.
- Illness share by age: illness or injury accounts for 2.8 of the 3.5 points among workers 55 and over.
One caveat applies to every 2025 figure. The BLS notes that its 2025 annual averages cover 11 months, because October 2025 data were not collected during the federal government shutdown, so they aren't strictly comparable with other years.
In days, the 1.7% lost worktime rate across 260 workdays a year comes to about 4.4 days per employee, our own multiplication. That answers "How many days a year does the average employee miss?" for US full-time workers.
Average absenteeism by industry and occupation
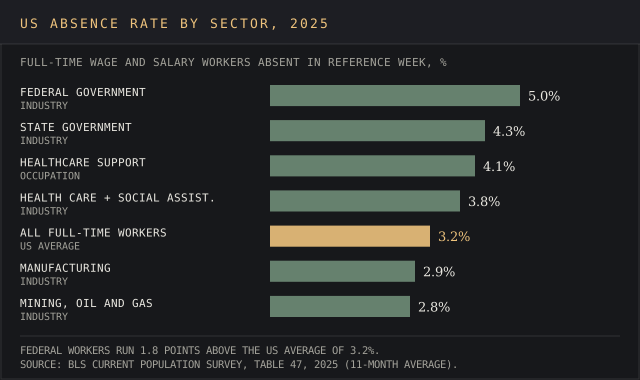
Industry and sector absence averages vary widely. The 2025 BLS table puts the full spread of major industries between 2.2% and 5.0%:
| Industry or occupation, 2025 | Absence rate | Lost worktime rate |
|---|---|---|
| Federal government | 5.0% | 2.6% |
| State government | 4.3% | 2.2% |
| Personal care and service occupations | 4.3% | 2.1% |
| Public sector (all) | 4.2% | 2.2% |
| Healthcare support occupations | 4.1% | 2.2% |
| Health care and social assistance | 3.8% | 2.1% |
| Local government | 3.8% | 2.0% |
| All full-time workers | 3.2% | 1.7% |
| Private sector (all) | 3.0% | 1.6% |
| Manufacturing | 2.9% | 1.6% |
| Mining, quarrying, and oil and gas extraction | 2.8% | 2.4% |
| Construction and extraction occupations | 2.7% | 1.5% |
Want an industry comparison chart like this for your own sector? Send the industry and the years.
Email a briefUtilities post the lowest industry absence rate at 2.2%, and architecture, engineering and management occupations the lowest occupational rate at 2.5%. Mining, quarrying, and oil and gas extraction shows the gap between the two BLS measures: a below-average 2.8% absence rate with an above-average 2.4% lost worktime rate, so fewer workers are absent but each absence runs longer.
Health care and social assistance sits above the national rate for a reason the data supports: illness or injury makes up 2.4 points of its 3.8% rate, and healthcare support occupations log 2.8 points of illness absence. Older data quoted across the web puts healthcare support at 4.7% and the federal lost worktime rate at 2.6%; the 2025 table confirms the second and puts the first at 4.1%.
Absence rates outside the US
The UK's Office for National Statistics put the UK sickness absence rate at 2.0% of working hours in 2024, down from 2.3% in 2023, with 148.9 million working days lost, or 4.4 days per worker. The public sector ran at 2.9% against 1.8% in the private sector. Minor illnesses were the top reason for the third year running, at almost a third of cases, followed by musculoskeletal problems at 15.5%.
Employer surveys run higher. The CIPD and Simplyhealth's 2023 Health and wellbeing at work survey, covering 918 organizations and 6.5 million employees, found:
- 7.8 days of absence per employee per year, 3.4% of working time, the highest in over a decade
- 5.8 days in the pre-pandemic 2019 survey
- 10.6 days per employee in the public sector against 5.8 in private sector services
- 5.0 days at employers with 50 or fewer staff, against 13.3 days at organizations with 5,000 or more
- The countries, sectors or absence measures to compare
- Regions, years and segments
- Where it runs: blog, white-label, gated or lead magnet
- Whose byline goes on it
- Deadline
- 2,500+ words, human-written
- Every figure linked to its source
- Yours to publish, under your name or none
- Hosting here for +$200, with your sponsored links
The gap between the ONS's 4.4 days and the CIPD's 7.8 is a matter of method, and the two sources aren't on the same page about what counts. The ONS asks workers in a household survey, and the CIPD asks HR teams to report absence across their headcount, which captures more of the long-term sickness absence that drives the public sector figure.
What is a good absenteeism rate?
A normal absenteeism rate is the one that matches your industry average, and the acceptable absenteeism rate varies with the work. A hospital ward at 4% sits close to healthcare support's 4.1%; a software team at 4% sits well above professional services at 2.9%. Commentary across HR sites puts a healthy range at about 1.5% to 3%, but no statistical body publishes that band, so treat it as a rule of thumb.
Three readings help:
- Below 2%: under every published average. Check for presenteeism before you jump for joy.
- 2% to 4%: inside the BLS range for most industries in 2025.
- Above 4% for several months: high or persistent absenteeism that warrants a look at causes.
A zero absence rate is a red flag of its own. The CDC Foundation, citing Harvard Business Review, puts the cost of employees working while sick at $150 billion to $250 billion a year, about 60% of the total cost of worker illness. A team showing no absence may be burning the candle at both ends and showing up sick.
What absenteeism costs an employer
The CDC Foundation reports that productivity losses linked to absenteeism cost US employers $225.8 billion a year, or $1,685 per employee. The figure is old: CDC was already quoting it in 2012, so read it as an order of magnitude.
The fuller picture comes from SHRM and Kronos, whose survey of 1,280 organizations put the US total absence cost at 20.9% to 22.1% of payroll. That figure covers planned and unplanned absence together, the whole nine yards of absence spending:
- Direct costs: 15.4% of payroll, made up of paid time off (8.1%), overtime (5.7%) and replacement workers (1.6%)
- Indirect costs, mainly lost productivity: 6.2% of payroll, rising to 6.7% for unplanned absence
- Replacement workers were 31.1% less productive than the absent employee, and 36.6% less for unplanned absences
- 72% of US respondents saw higher unplanned absence on Mondays, Fridays, before holidays or around big sporting events
Europe's total ran at 36.3% to 38.3% of payroll in the same survey, and Australia's at 32.8% to 34.0%, mostly because of higher paid-leave entitlements.
High absenteeism also disrupts workflow, and absences affect productivity beyond the absent person: co-workers covering an absence were rated 29.5% less productive and supervisors 15.7% less productive during a typical absence. That's a payroll line, and unplanned absence accounted for the largest perceived productivity loss in every region except China.
Co-workers covering an absence were rated 29.5% less productive during a typical absence, and supervisors 15.7% less, per the SHRM and Kronos absence survey.
Productivity drop for co-workers covering an absence
Source: SHRM and Kronose.g. absence costs in the industries you sell to
Source: linked, checked, datedWhat causes absenteeism
Illness and injury cause most absence on every official count. In the BLS data, illness or injury makes up 2.2 of the 3.2 points; in the ONS data, minor illnesses lead, then musculoskeletal problems.
Employer surveys add the causes HR sees behind the sick days:
- Stress and mental health issues: 76% of CIPD respondents reported stress-related absence in the past year, and mental ill health was the top cause of long-term absence.
- Long-term illness: long spells off sick drive the public sector figures in both UK datasets.
- Family obligations: the BLS "other reasons" rate is 1.4% for women against 0.7% for men.
- Work itself: scheduling and workload issues, poor manager relationships and poor work-life balance, which raise absence through burnout.
An occasional mental health day sits in the same unplanned absence count as flu, so the absenteeism data alone can't tell you which you're looking at. Absence patterns let you read between the lines, because absences happen in clusters for some causes and in long spells for others.
Absence frequency and other absence metrics
The absenteeism rate tells you how much time was lost. It can't tell you if that came from one person off for a month or ten people off for a few missed days. Absence frequency fills that gap.
- Absence frequency measure: the number of separate absence instances per employee in a period. Ten one-day absences count as ten instances; one ten-day absence counts as one.
- Average absence duration: days lost divided by absence instances.
- Bradford factor: instances squared multiplied by days lost, a UK practice that weights repeated absence more heavily than one long spell.
- Lost worktime rate: the BLS's hours-based measure, useful for shift and part-time staff.
Read absence frequency next to the absenteeism rate. Read together, absence frequency, absenteeism rate and duration separate a team with one extended absence (low frequency, high rate) from a team with repeated absence (high frequency, moderate rate), and each calls for a different response. Absenteeism rate metrics work best as a set: rate, frequency, duration and day-of-week pattern.
Data driven absence reporting
To combine absence data from payroll, scheduling and HR systems, use one definition of an absence day across all three and record absences on the day absences happen. Recorded absence that arrives weeks late breaks the monthly view. Compare each team's absenteeism rate with the same period last year to strip out seasonal flu, and monitor absence by day of week, since SHRM's respondents saw Mondays and Fridays spike.
Data driven absence reporting is how you turn absence data into a short list of teams to talk to. It lets HR spot early signs of burnout and nip them in the bud before they become resignations.
How to reduce absenteeism
The strongest published evidence on how to reduce absenteeism is about engagement. Gallup's 2024 Q12 meta-analysis of 183,806 business units across 347 organizations found units in the top quartile of engagement had 78% lower absenteeism than units in the bottom quartile. Other levers have weaker data behind them but show up in every employer survey:
- Supportive absence policies: a written policy on how to report absence and what happens after a return, applied evenly.
- Health and wellbeing support: occupational health services, mental health services through an employee assistance program and access to occupational medicine for workers on extended absence.
- Flexible work: flexible hours and remote options target absence for appointments and family obligations, which make up the BLS's other-reasons rate.
- Manager training: return-to-work conversations and early contact during long absences.
HR tip: treat absenteeism as a symptom. A rising rate in one team points to something in that team, and burying your head in the sand won't fix it. Programs aimed at workforce health help protect employee wellbeing and achieve meaningful business outcomes when they're tied to the patterns in the data.
Delivered for your site and your byline. Hosting here is optional.
Frequently asked questions
What is the average absenteeism rate?
3.2% for US full-time wage and salary workers in 2025, with 1.7% of usual hours lost (BLS). The UK sickness absence rate was 2.0% of working hours in 2024 (ONS).
How do you calculate absenteeism rate?
Divide days of unplanned absence by available workdays (employees multiplied by scheduled days) and multiply by 100. A 500-person organization with 4,000 absence days across 250 workdays has a 3.2% rate.
What is considered a good absenteeism rate?
One at or below your industry average: 2.9% for manufacturing, 3.0% for the private sector and 4.2% for the public sector in 2025 (BLS). A rate near zero can signal people working while sick.
How many days a year does the average employee miss?
About 4.4 days in the US, from the 1.7% lost worktime rate across 260 workdays, and 4.4 days in the UK on the ONS count for 2024. UK employers in the CIPD survey recorded 7.8 days per employee.
What is the biggest cause of employee absenteeism?
Illness or injury: 2.2 of the 3.2 points of US absence in 2025. Stress and mental ill health lead the causes of long-term absence in UK employer surveys.
How many absences is 90% attendance?
26 days a year on a 260-day schedule. That's a 10% absenteeism rate, about three times the US average.
Is 12 absences in a year bad?
Twelve days over 260 workdays is a 4.6% rate, above the 3.2% US average and the 4.2% public sector rate. Twenty absences is 7.7%. Three absences in six months is about 2.3%, under the average.
Bottom line
The US absenteeism rate was 3.2% in 2025, with 1.7% of hours lost, and illness or injury caused about two-thirds of it. Rates run from 2.2% in utilities to 5.0% in the federal government, so the useful benchmark is your own industry's row in the BLS table.
Calculate the rate the same way every month, read it next to absence frequency and duration, and watch the trend over the same period each year. Engagement has the strongest published link to lower absence, and a rate near zero deserves as much attention as one above 4%.
HR software vendors, payroll providers and benefits consultants publish reports like this one as lead magnets and client briefs.
A report on your topic for a blog page, gated content or a lead magnet.
Written for your client and published under their brand, with my name left off.
Your report on marketintelligencetools.com, with 2 to 3 CTAs carrying your sponsored links.
Default terms: the report is yours to publish, and I keep the right to republish it on this site behind a gate, outside Google's index.
The labor tables, UK surveys and cost studies behind each absence figure, and where US data runs out
Government sources: bls.gov (Current Population Survey Tables 46 and 47, 2025 annual averages), ons.gov.uk (Sickness absence in the UK labour market: 2023 and 2024, June 2025) and gateway.euro.who.int (WHO Europe indicator, absenteeism from work due to illness).
Employer and research sources: cipd.org (Health and wellbeing at work 2023, with Simplyhealth, September 2023), shrm.org (Total Financial Impact of Employee Absences, with Kronos, 2014), gallup.com (Q12 meta-analysis, 2024) and cdcfoundation.org (cost of absenteeism to US employers).
All figures checked 20 November 2026. The BLS rates come from a household survey, and the US has no federal employer survey of absence days to match the CIPD's, so every payroll cost figure on this page comes from a private study.