Millennials statistics 2026: population, money, housing, work and how they compare
 By Jan Suski. I go deep on every review, checking every number against its source and digging up details other coverage misses, a habit from six years of SEO and link building for tech companies. Bylines at Brand24 and Senuto. How the scoring works.
About 73 million millennials lived in the United States in July 2025, aged 29 to 44 and roughly one in five Americans, making the millennial generation the largest living generation, a hair ahead of Gen Z. That's the Census Bureau's Vintage 2025 population estimates summed across the millennial birth years, 1981 to 1996. They're now squarely in middle age, and the numbers on wealth, housing and family show a generation that started late and is catching up unevenly.
This report gathers the millennials statistics that hold up to checking: population and diversity, education, jobs and the unemployment rate, income and wealth, student debt, housing, marriage and family, spending, social media and politics. Each figure links to the agency or research house that produced it, and each carries its year, because a 2018 Pew number describes millennials aged 22 to 37 and a 2026 number describes millennials aged 30 to 45.
It's for marketers, recruiters, analysts and journalists who need millennials statistics on young adults and Americans in mid-career that they can defend. Where sources disagree, the gap is explained in its own section.
The numbers US millennials, born 1981 to 1996, checked November 2026
Millennials are the best-educated adult generation so far, yet households headed by millennials and Gen Z together hold 11.2% of US wealth against 52.5% for baby boomers.
The median first-time buyer is now 40, the oldest on record, against the late 20s for young adults buying in the 1980s.
Financial pressure is the generation's defining complaint: nearly half live paycheck to paycheck, and 52% of millennials say they've delayed major life decisions because of money.
Brands, agencies and lenders quote millennial numbers in every plan. Send the country, the age band or the category and I'll source a version you own.
Who millennials are: birth years, generation Y and the age range in 2026
Pew Research Center defines millennials, also called generation Y, as Americans born from 1981 to 1996, and that definition is the one most data sets follow. In 2026, millennials span 30 to 45 years old, which means the youngest are settling into careers and the oldest are approaching middle age.
Pew set the 1996 cutoff in a 2019 explainer on where millennials end and Generation Z begins.
Pew's reasons: most millennials were 5 to 20 years old on September 11, 2001; most entered the workforce during the Great Recession; and they adapted to social media and smartphones as young adults, where post millennials grew up with both from a young age. Pew called Gen Z "post millennials" before settling on the Gen Z label, and some marketers still call Generation X and boomers the pre millennials. Young people born after 1996 sit in the next generation.
| Generation | Birth years | Age range in 2026 |
|---|---|---|
| Silent generation | 1928 to 1945 | 81 to 98 |
| Baby boomers | 1946 to 1964 | 62 to 80 |
| Generation X | 1965 to 1980 | 46 to 61 |
| Millennials (generation Y) | 1981 to 1996 | 30 to 45 |
| Generation Z | 1997 to 2012 | 14 to 29 |
Not every source uses the same years, and that's how each source defines millennials differently. The National Association of Realtors splits older millennials (1980 to 1989) from younger millennials (1990 to 1998), and Deloitte's global survey uses 1983 to 1994.
The Federal Reserve's wealth data groups everyone born in 1981 or later together, so its "millennials" include Gen Z. Read the age range before you compare two millennials statistics, the first rule of any demographic market segmentation; a mismatch of three birth years can move a percentage by several points.
Peak millennial years are the late 1980s and early 1990s. The US recorded about 4.1 million births in 1990, the high point of the "echo boom" from the children of baby boomers, which is why the millennial population outnumbers Gen X.
How many millennials there are: the demographic bridge
Summed across ages 29 to 44, the Census Bureau's Vintage 2025 estimates put the millennial population, the count of millennials in the U.S, at about 73 million on July 1, 2025, roughly 21% of the total population and about a quarter of US adults. Gen Z, at about 72 million Americans, is close behind, baby boomers number about 67 million and Generation X about 64 million. Among other generations, only Gen Z comes close to the millennial population.
Brookings Institution demographer William Frey called millennials "a demographic bridge to America's diverse future" in a January 2018 analysis. At the time, millennials were over 75 million strong, nearly a quarter of the total population, 30% of the voting-age population and almost two-fifths of the working-age population.
- 44% of millennials are racial or ethnic minorities, per Brookings
- 55% of millennials aged 22 to 37 were non-Hispanic white in 2018, against 84% of the Silent generation at the same age, per Pew
- The racially diverse younger generations behind millennials are more diverse again: Gen Z has an even smaller white share
Frey's demographic bridge framing explains the gap between generations: largely white older generations on one side, racially diverse younger generations on the other, and millennials in the middle of the demographic makeup.
Ethnic diversity is the defining demographic fact of the millennial generation, and the demographic bridge idea rests on it: ethnic minorities make up a larger share of millennials than of any older generation.
Immigration keeps the count high, since many immigrants arrive as young adults in their 20s and 30s. The millennial generation overtook baby boomers as America's largest generation in 2019, according to Pew Research.
Education: the most educated adult generation so far
Millennials stayed in school longer than earlier generations and previous generations of young adults, and the gap shows at the same age. In 2018, 39% of millennials aged 25 to 37 held a bachelor's degree or higher, against 29% of Gen Xers, about a quarter of baby boomers and 15% of the Silent generation at the same age, per Pew Research Center.
- Millennial women: 43% held a bachelor's degree, against 36% of millennial men
- Generation X at the same age: 29% held a bachelor's degree
- Silent generation women at the same age: 11%, against 19% of men
- More than a third of millennials aged 25 to 34 had a college degree by 2015, up from under 30% for that age group in 2000, per Brookings
The gender gap flipped in two generations. Silent generation men out-graduated women by 8 points; millennial women out-graduate millennial men by 7. That shift in higher education feeds through to the labor force data below, where millennial women work at rates no earlier generation of women matched.
A high school diploma alone carries less weight for millennials than for boomers. Pew found college-educated millennials earned about $56,000 a year, roughly what Gen X graduates earned at the same age, while millennials with only some college earned $36,000, against $38,900 for early boomers in 1982.
Millennial workers and the labor force
Millennials make up the largest share of the US labor force, and millennial workers now span the 25 to 34 and 35 to 44 age groups. In October 2026 the unemployment rate for workers aged 35 to 44 was 3.4% and for those aged 25 to 34 was 4.5%, seasonally adjusted, against 4.1% for all workers 16 and over, per the Bureau of Labor Statistics.
| Age group, October 2026 | Unemployment rate |
|---|---|
| 20 to 24 | 7.5% |
| 25 to 34 | 4.5% |
| 35 to 44 | 3.4% |
| 45 to 54 | 2.7% |
| 55 and over | 2.8% |
| All workers 16+ | 4.1% |
Copy these lines into an email, fill them in and send. I reply with scope and a price within 2 to 3 business days.
Open the emailToday's unemployment rate for millennials is a long way from where they started. Most millennials entered adulthood during the Great Recession of 2007 to 2009, when the unemployment rate for young adults and young people entering the labor force ran far above today's levels, and Pew links that start to slower earnings growth through their 20s.
Millennial women changed the labor force more than earlier generations of women did. In 2018, 72% of millennial women aged 22 to 37 were employed and about 25% were out of the labor force, against 40% employed and 58% out of the labor force for Silent generation women at the same age in 1966, per Pew. Young boomer women sat in between, at 66% employed in 1985.
Deloitte's 2026 survey of 8,211 millennials found 74% of millennials and Gen Zs use AI in their day-to-day work, up from about 57% a year earlier. Our employee engagement statistics report covers how that workforce reports engagement and burnout.
Income, wealth and the paycheck-to-paycheck problem
Millennials earn more than previous generations did at the same age, and hold less. In 2018, the median household income of millennial households, adjusted for household size, was about $71,400, against $70,700 for Gen X households in 2001, per Pew. Wealth went the other way: median household net worth for adults aged 20 to 35 was about $12,500 for millennials in 2016, against $15,100 for Gen X and $20,700 for boomers at the same age.
A decade on, the totals have grown and the share hasn't. In the second quarter of 2026, households headed by someone born in 1981 or later, millennials plus Gen Z, held $20.8 trillion, 11.2% of US household net worth, per the Federal Reserve's Distributional Financial Accounts.
| Generation (household head), Q2 2026 | Net worth | Share of US household wealth |
|---|---|---|
| Baby boomers | $97.4 trillion | 52.5% |
| Gen X | $47.7 trillion | 25.7% |
| Millennials and Gen Z | $20.8 trillion | 11.2% |
| Silent generation and earlier | $19.8 trillion | 10.7% |
Baby boomers hold almost five times as much wealth as millennials and Gen Z combined, though the two groups are similar in total population. Home equity and stock holdings explain most of the gap, and both reward having bought in early, which most millennials couldn't.
Living costs set the mood. In Deloitte's 2026 Gen Z and Millennial Survey, fielded from November 2025 to January 2026 across 44 countries:
- 47% of millennials and Gen Zs, almost half, said they live paycheck to paycheck, down from 52% in the previous year
- 42% of millennials named cost of living as their top concern, for the fifth straight year
- 52% of millennials, more than half, said they'd delayed major life decisions, such as starting a family, because of their finances
- 64% of millennials said housing affordability affects their career decisions
- 39% of millennials named their long-term financial future as a top source of stress
Those are global figures, but the US pattern is the same: millennials earn more than their parents at the same age and own a smaller slice of the pie. Well being shows up as a priority in Deloitte's data too, for the majority of millennials, with both generations unwilling to trade health for promotion. Health also shows up in attendance: US full-time workers lost 1.7% of their usual hours to absence in 2025, per our absenteeism rate benchmarks.
Student debt by age group
Student debt is concentrated in the millennial age range, and older millennials in the 35 to 49 age group carry the most. As of September 30, 2025, borrowers aged 35 to 49 owed about $675 billion in federal student loans, the largest total of any age group, and borrowers aged 25 to 34 owed about $480 billion, per the Department of Education's Federal Student Aid portfolio data.
- Ages 25 to 34: about 14.3 million borrowers, average balance $33,566
- Ages 35 to 49: about 15 million borrowers, average balance $45,295
- The federal portfolio totals about $1.7 trillion across about 42.6 million borrowers
Average balances rise with age because interest accrues and borrowers return for graduate degrees. For many millennials, student debt sits alongside a mortgage and childcare, and parents saving for their own children's education are still paying off their own higher education costs. Those children are mostly Generation Alpha, born from 2013, as our Generation Alpha statistics show.
Millennial workers: what they want from employers
Millennial workers want pay, flexibility and a clear path up, in that order of urgency. Deloitte's 2026 survey found higher pay, flexible work arrangements (tracked in our remote work statistics) and a clearer route to the top would make millennials and Gen Zs more likely to pursue leadership roles, and that a lack of recognition was the second-biggest driver of job-related stress after long-term financial worries.
- 74% of millennials and Gen Zs use AI in their day-to-day work, up from about 57% a year earlier
- 39% of millennials named their long-term financial future as a top source of stress
- 42% of millennials ranked cost of living as their top concern
- 64% said housing affordability affects their career choices, from taking a new job to relocating
For employers, the practical reading of Deloitte's data is that pay and flexibility come first, with well being close behind. Those same demands shape how millennial managers run teams of Gen Z hires, the next generation into the labor force.
Many millennials are raising young children while working full time: Numerator's panel found 48% of millennial households have children under 18 at home. That load shapes personal lives, career choices and spending at the same time.
Millennials around the world
The millennial label travels, but the experience doesn't. Deloitte's 2026 survey covered 8,211 millennials across 44 countries in North America, Latin America, Western Europe, Eastern Europe, the Middle East, Africa and Asia Pacific, and the financial pressure figures hold across regions: nearly half of millennials and Gen Zs globally live paycheck to paycheck.
Country splits show how local housing markets change the picture. In Australia, 45% of millennials said housing affordability affects their career decisions, against 64% of millennials globally, according to Deloitte's Australia country report. Millennials in western countries, Latin America and Asia answered the same questions, and the country reports show how far local housing costs move the answers.
For US analysts, the warning is the same as with any global survey: a global millennials statistic is an average of unlike economies, and quoting it as a US figure misses the point.
Where millennials live: homeowners and millennial renters
On the buyer side of the real estate market, millennials made up 26% of US home buyers in the year covered by the National Association of Realtors' 2026 Home Buyers and Sellers Generational Trends report: older millennials 15% and younger millennials 11%. Baby boomers were 42% of buyers and Gen X 25%.
- First-time buyers fell to 21% of all buyers, the lowest since NAR began tracking in 1981
- 60% of younger millennial buyers were first-time buyers, down from 71% a year earlier; 33% of older millennial buyers were
- Older millennial buyers had the highest median household income of any generation, $132,700, and bought the largest homes, at a 2,100 square foot median
- The median age of first-time buyers hit 40, a record; it was in the late 20s in the 1980s
More than half of millennials own a home now: Numerator's 2025 panel found 45% don't yet own one. That still leaves a large group of millennial renters in their 30s and 40s, paying rent while saving for a down payment, and the median age of first-time buyers says most will buy at 40 or later.
Living with parents is the other housing story, and it's where millennials live differently from older generations.
In 2018, 15% of millennials aged 25 to 37 lived in their parents' home, against 8% of early boomers and the Silent generation at the same age, per Pew. In 2025, 16% of all young adults aged 25 to 34 lived in a parents home, as did 58% of those aged 18 to 24, per the Census Bureau. Moving slowed too: 16% of millennials aged 25 to 37 moved in the past year in 2018, against about 25% of previous generations at the same age.
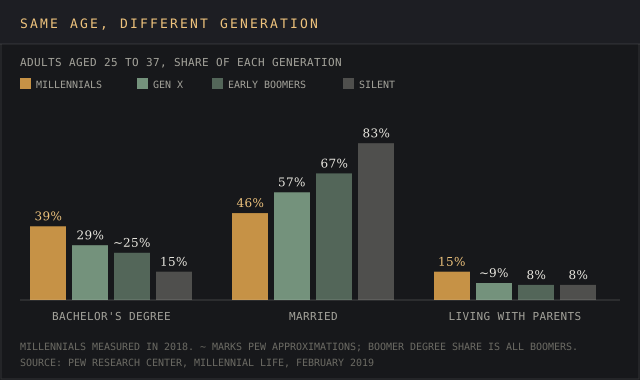
Want a same-age generation chart like this for your country? Send the measures and the years.
Email a briefMarriage, family and personal lives
Millennials are delaying marriage compared with older generations, and the Census data show the trend has kept going into the next generation. The median age at first marriage reached 30.8 for men and 28.4 for women in 2025, up from 23.5 and 21.1 in 1975, per the Census Bureau.
- 46% of millennials aged 25 to 37, less than half, were married in 2018, against 57% of Gen X, 67% of early boomers and 83% of the Silent generation at the same age (Pew)
- Among Black millennials aged 25 to 34, the share currently married fell from 47% in 1980 to 23% (Brookings)
- 48% of millennial households have children under 18 at home, per Numerator's 2025 consumer panel
The delay is financial as much as cultural. Deloitte's finding that 52% of millennials put off major life decisions because of money points the same way as the marriage data, and Numerator found 46% of millennials feel behind their peers on traditional milestones.
What millennials spend and how they shop
Millennials accounted for 26.1% of US spending on consumer packaged goods, general merchandise and quick-service restaurants in the 12 months to June 2025, per Numerator. Gen X led at 34.1% and boomers held 33.7%. Millennials and adult Gen Z together reached 32%, up 8 points from 2020.
- Millennials are almost twice as likely as the average American shopper to buy children and baby brands, reflecting how many have young kids
- 45% of millennials don't yet own a home, so the majority of millennials do
- 65% say they personally identify with their generation
Millennial customers are now in their peak family-spending years, and close to half have children under 18 at home. Brands that built their millennial marketing for 25-year-olds in 2015 are selling to parents in 2026, and the spending data shows it: millennials spend on children's products, groceries and household goods, with children's education and housing as the big fixed costs.
Millennials, social media and the digital age
Millennials were the first generation to come of age online, though not from a young age, and they remain heavy social media users, as our social media statistics report shows. Pew's 2026 social media fact sheet found 84% of US adults use YouTube and 70% use Facebook, with usage highest among adults under 50.
The digital age shaped how millennials discover brands: social media, streaming services and online reviews. Popular culture moved online as they grew up, from social networks to streaming services, and the entertainment industry followed. In a 2021 Pew survey, 59% of millennials who saw climate change content on social media said it made them feel anxious about the future, against 46% of Gen X and 41% of boomers and older.
Politics, voting and climate change
Millennials made up 30% of the voting-age population of Americans in 2018, per Brookings, and Pew found millennials were the adult generation most likely to identify with or lean toward the Democratic Party in its 2018 analysis of the generation gap in American politics. Both Pew and Brookings found millennials less likely to vote than older generations at the same point in their lives.
The 2024 election moved younger voters. Pew's validated voter study found 8% of Biden's 2020 voters under 50 switched to Trump in 2024, while 4% of voters in that age group went from Trump to Harris. Much of the shift among voters born in the 1990s came from changes in who turned out.
Climate change is where millennials and Gen Z stand apart. In Pew's 2021 survey, 28% of millennials had taken at least one action on climate change in the past year, such as donating, volunteering or contacting an official, against 32% of Gen Z, 23% of Gen X and 21% of boomers and older.
Millennials compared with Gen X, Gen Z and baby boomers
Generation comparisons only work at the same age, and Pew Research built its millennial studies around that rule. This table lines up the measures Pew and NAR publish for each generation; the gaps between millennials and other generations are larger than the gaps between millennials and Gen Z.
| Measure | Millennials | Gen X | Baby boomers | Silent generation |
|---|---|---|---|---|
| Bachelor's degree or higher at 25 to 37 | 39% | 29% | About 25% | 15% |
| Married at 25 to 37 | 46% | 57% | 67% (early boomers) | 83% |
| Living with parents at 25 to 37 | 15% | About 9% | 8% (early boomers) | 8% |
| Median net worth at 20 to 35 | $12,500 (2016) | $15,100 | $20,700 (1983) | Not published |
| Share of 2025 home buyers | 26% | 25% | 42% | 4% |
- The country, age band and category to cover
- Regions, years and segments
- Where it runs: blog, white-label, gated or lead magnet
- Whose byline goes on it
- Deadline
- 2,500+ words, human-written
- Every figure linked to its source
- Yours to publish, under your name or none
- Hosting here for +$200, with your sponsored links
Gen X and Gen Xers in general sit between millennials and boomers on most measures, and pre millennials as a group hold most of the wealth; Gen Xers were more likely to be married at the same age, 57% against 46%.
Earlier generations come out ahead on wealth and homeownership at the same age. On education the order flips. The younger generations are more educated, more diverse and later to marry, a pattern our Gen Z statistics report tracks for the cohort behind millennials.
Who is more successful, Gen Z or millennials? On wealth, the jury's still out: the Fed groups them together, and Gen Z has had less time in the housing market to build equity.
The events that shaped the millennial generation
Pew's case for treating millennials as one generation rests on shared events at the same age. Lined up by year, they explain a lot of the data above:
- 1981 to 1996: millennials born, with births peaking around 1990 at about 4.1 million a year
- 2001: the September 11 attacks, when most millennials were 5 to 20 years old
- 2007: the iPhone launches; the oldest millennials are 26 and the youngest 11
- December 2007 to June 2009: the Great Recession, as most millennials entered the labor force
- 2008: millennials aged 12 to 27 during an election where the youth vote became a major political story
- 2019: millennials overtake baby boomers as the largest generation of Americans, per Pew Research
- 2020: the pandemic hits as the oldest millennials turn 39
- 2025: the median age of first-time home buyers reaches 40, per NAR
Two recessions before the oldest millennials turned 40 is the thread that runs through millennials statistics on wealth, housing and marriage, and it lines up with the late homebuying in NAR's data for young adults of the 2010s.
How to use millennials statistics: a checklist
Marketers building a user persona, recruiters and analysts misuse millennials statistics in predictable ways. A short checklist catches most of them:
- Check the age range. A 2018 figure describes 22 to 37 year olds; a 2026 figure describes 30 to 45 year olds. Same generation, different life stage.
- Check the birth years. Pew, NAR, Deloitte and the Fed each draw the line differently.
- Check the country. Deloitte's figures are global averages; Census, BLS and Fed figures are US only.
- Check the unit. Household figures, like the Fed's wealth data, are grouped by the age of the household head, so a millennial living in a parents home counts toward the parents' generation.
- Compare at the same age. Comparing millennials in 2026 with Gen Z in 2026 mixes a 40-year-old with a 25-year-old. Compare each generation at the same age, as Pew does.
Used that way, millennials statistics answer practical questions: how many millennial customers have young children (48% of millennial households), how many millennial workers feel financial stress (39% name their long-term future), and how many young adults still rent.
Why millennials statistics disagree
Search for the number of millennials and you'll find 72 million, 72.95 million, 73 million, 74.2 million and 75.4 million. Each is correct for its source and date:
- Different birth years. Pew's 1981 to 1996, NAR's 1980 to 1998 and Deloitte's 1983 to 1994 produce different counts and averages.
- Different dates. Pew counted 75.4 million millennials in the U.S in 2015 data; immigration and mortality changed the count every year since.
- Grouped generations. The Fed's wealth data folds Gen Z into millennials, so its $20.8 trillion figure covers anyone born in 1981 or later.
- Global against US. Deloitte's 47% paycheck-to-paycheck figure covers 44 countries; many pages quote it as a US number.
- Stale studies. The 2018 Pew snapshot of millennials aged 22 to 37 is still quoted as current, though the youngest millennials are now 30.
Before you quote a millennial statistic, check the age range, the year and the country. The vast majority of conflicts between two pages trace back to one of the three.
Delivered for your site and your byline. Hosting here is optional.
Frequently asked questions
What years are millennials?
Millennials were born from 1981 to 1996, per Pew Research Center, which makes them 30 to 45 years old in 2026.
What year are peak millennials?
The largest millennial birth cohorts were born around 1989 to 1991, when US births ran at about 4.1 million a year.
How many millennials are in the U.S.?
About 73 million in July 2025, per Census Bureau Vintage 2025 estimates summed for ages 29 to 44, roughly 21% of the population.
What are millennials most known for?
In the data: more millennials hold a bachelor's degree than any earlier generation, later marriage, later homebuying and more racial and ethnic diversity than older generations.
Who is more successful, Gen Z or millennials?
It depends on the measure. Millennials hold more wealth and more homes today because they're older, and same-age comparisons with Gen Z aren't available yet for most measures.
Why is Gen Z so different from millennials?
Gen Z grew up with smartphones and social media from childhood, while most millennials adopted them as young adults. Most millennials also started work during the Great Recession, which Gen Z missed.
What is the rarest generation?
The Greatest Generation, born before 1928, is the smallest living group of Americans. Among generations with large living populations, the Silent generation is the smallest, at about 14 million Americans in 2025.
Bottom line
About 73 million millennials are now 30 to 45, the largest generation of Americans, more educated and more diverse than any before them. They've caught up on income and are still behind on wealth: millennials and Gen Z together hold 11.2% of household wealth, and the median first-time home buyer is 40.
For anyone using millennials statistics, the rule is simple: match the age range, the year and the country before comparing two numbers, because most of the disagreement in published figures comes from those three choices.
Brands, agencies and fintechs use reports like this one in pitches, media plans and investor decks.
A report on your topic for a blog page, gated content or a lead magnet.
Written for your client and published under their brand, with my name left off.
Your report on marketintelligencetools.com, with 2 to 3 CTAs carrying your sponsored links.
Default terms: the report is yours to publish, and I keep the right to republish it on this site behind a gate, outside Google's index.
Which source defines millennials how, and the numbers nobody updates
Population is the Census Bureau's Vintage 2025 national estimates by single year of age, summed for ages 29 to 44. Generation definitions are Pew Research Center's January 2019 note. Same-age comparisons are Pew's February 2019 Millennial Life report, and diversity and voting-age shares are William Frey's January 2018 Brookings analysis.
Wealth is the Federal Reserve's Distributional Financial Accounts for the second quarter of 2026, which group everyone born in 1981 or later together. Housing is the National Association of Realtors' 2026 Home Buyers and Sellers Generational Trends (15 April 2026).
Marriage and living arrangements are the Census Bureau's 2 December 2025 release. Unemployment is BLS Employment Situation table A-10 for October 2026. Student debt is Federal Student Aid portfolio data as of 30 September 2025.
Attitudes are Deloitte's 2026 Gen Z and Millennial Survey (fielded November 2025 to January 2026, 44 countries). Spending is Numerator's 29 September 2025 release. Social media and politics are Pew's 2026 social media fact sheet, its 2021 climate survey and its June 2025 validated voter study. Every figure was checked in November 2026. No US agency publishes wealth or spending for millennials alone, separate from Gen Z.