Influencer marketing statistics 2026: five houses, one industry, a $10.5B to $37B spread
 By Jan Suski. I go deep on every review, checking every number against its source and digging up details other coverage misses, a habit from six years of SEO and link building for tech companies. Bylines at Surfer, Brand24, and Senuto. How the scoring works.
The numbers Global and US influencer marketing, checked 17 October 2026
The broadest estimate is 3.5 times the narrowest, because the IAB counts all creator ad spend and eMarketer counts only payments to influencers.
Budgets are still rising in most marketer surveys, but the share of brands putting over 40% of marketing budgets into influencers halved in 2025.
Small accounts win on engagement by a wide margin on Instagram and by a narrow one on TikTok.
I'll write a 2,500+ word report on the market you name, with spend, rates and engagement figures linked to their sources. Yours to publish, from $200.
Influencer Marketing Hub puts the global influencer marketing industry at $32.55 billion for 2025. HypeAuditor, counting the same year, gets $22.2 billion. Those two figures are $10.35 billion apart, and neither publisher is wrong by its own method. That gap sits under every set of influencer marketing statistics you'll read this year.
This report collects influencer marketing stats on industry size, budgets, platforms, engagement rate by follower tier, what influencers charge on each social media channel, ROI, consumer trust, AI use and disclosure rules. Every figure links to the body that published it: a research house, a trade body, a regulator or the vendor whose survey produced the number. Vendor surveys are labelled as vendor surveys.
It's written for marketing professionals sizing an influencer budget, marketing agencies pitching influencer marketing campaigns, and analysts tired of recycled numbers. A lot of the most-quoted influencer marketing statistics trace back to a single 2019 vendor estimate, and a few trace back to nothing at all.
Influencer marketing statistics on industry size, 2014 to 2026
The industry figure quoted most often comes from Influencer Marketing Hub's 2025 report, built on a survey of 315 influencer marketers plus interviews with more than 100 practitioners. Its own series runs as follows:
- 2014: $1.4 billion
- 2019: $6.5 billion
- 2020: $9.7 billion
- 2024: $24 billion
- 2025: $32.55 billion, estimated
That's a 23-fold rise in eleven years on one publisher's method. The "$10 billion in 2020" line that circulates in listicles is this $9.7 billion figure, rounded. The Hub builds the series from its own survey work, and Statista's widely linked chart of the global influencer market republishes it, which gives one publisher the lion's share of the citations.
HypeAuditor's State of Influencer Marketing 2026 shows steady growth on its own projection: $19.8 billion in 2024, $22.2 billion in 2025, $26.5 billion in 2026 and $31.2 billion in 2027. HypeAuditor tracks 88.7 million Instagram, 14.5 million YouTube and 102 million TikTok influencer accounts in its database, and it also sells analytics to brands.
In the US, eMarketer's March 2025 forecast put influencer marketing spend at $10.52 billion for 2025, a 15.0% rise that added $1.37 billion, with growth of 15.7% expected in 2026. Apply that rate and 2026 lands near $12.2 billion. eMarketer had expected the market to cross $10 billion a year later; it moved the date forward after 2024 grew 23.7%.
Why influencer marketing industry size estimates diverge
Five publishers, five definitions. The influencer marketing industry size you quote depends on what each house decided to count, and the $26.48 billion between the lowest and highest 2025 figure is bigger than HypeAuditor's entire estimate.
| Publisher | Figure | Year | What it counts |
|---|---|---|---|
| eMarketer | $10.52 billion | 2025 | US brand spend paid to influencers |
| HypeAuditor | $22.2 billion | 2025 | Global influencer marketing, its own projection |
| Influencer Marketing Hub | $32.55 billion | 2025 | Global influencer marketing industry, survey-based estimate |
| Grand View Research | $34.2 billion | 2025 | Global influencer marketing platform market, software plus managed services |
| IAB | $37 billion | 2025 | US creator ad spend, including paid media behind creator content |
Copy these lines into an email, fill them in and send. I reply with scope and a price within 2 to 3 business days.
Open the email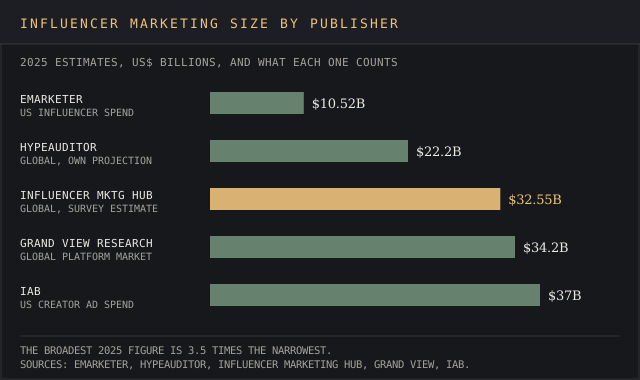
Three differences explain most of the spread:
- Geography. eMarketer and the IAB count the US only. The IAB's figure is still the largest on the table.
- Scope. The IAB's 2025 creator economy ad spend report counts creator ads, including the paid media brands buy to boost creator content. eMarketer counts payments to influencers.
- Product. Grand View Research's June 2026 report sizes the platform market, SaaS subscriptions and managed services, and forecasts $116.2 billion by 2033.
The devil's in the details with relabelled numbers. The "Instagram influencer marketing is worth $22 billion" line that circulates has no Instagram-specific source; it matches HypeAuditor's $22.2 billion for the whole industry.
Forecasts also drift against their own past. Influencer Marketing Hub's 2023 benchmark report, from a survey of about 3,500 people, projected $21.1 billion for 2023. Its 2025 report puts 2024 at $24 billion, so the series climbed $2.9 billion in a year where HypeAuditor counted $19.8 billion in total.
Influencer marketing inside the creator economy
The creator economy is the wider pool. It counts platform payouts, subscriptions, merchandise and every other way creators earn, and Goldman Sachs Research put it at $250 billion in 2023, heading to $480 billion by 2027. Influencer marketing is the slice brands pay for. The full set of houses for that wider market, from Goldman Sachs to Precedence Research, sits in our creator economy statistics report, so this page sticks to brand spend.
Influencer marketing budgets: what marketers plan for 2026
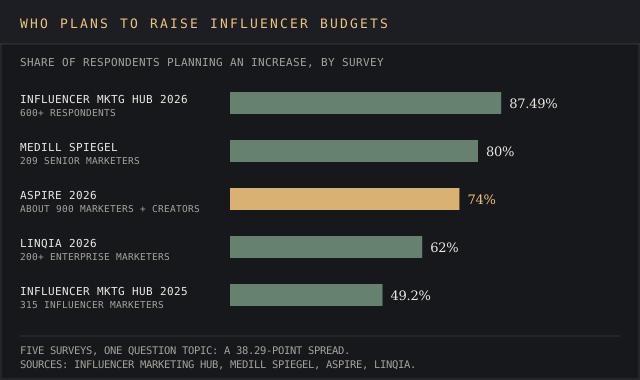
Most marketers plan to spend more. How many depends on who asked:
| Survey | Sample | Share raising influencer budgets |
|---|---|---|
| Influencer Marketing Hub Benchmark Report 2026 | 600+ respondents | 87.49% |
| Medill Spiegel Research Center, Creator Marketing 2026 | 209 senior marketers, June 2026 | 80% |
| Aspire, State of Influencer Marketing 2026 | About 900 marketers and creators | 74% |
| Linqia, 2026 State of Influencer Marketing | 200+ enterprise marketers | 62% |
| Influencer Marketing Hub 2025 report | 315 influencer marketers | 49.2% |
Want a budget-intent chart like this for your own buyers? Send the market and the surveys.
Email a briefThe five readings sit 38.29 points apart. Influencer Marketing Hub's 2026 benchmark report sits at the top: 87.49% expect budgets to rise and 72.22% expect a rise of 50% or more. Read between the lines before quoting it. The same page gives 70.20% for that 50%-plus group in a later section.
Aspire's 2026 report is the source of the "74% of marketers plan to increase" line, and the "76%" variant on some pages has no source behind it. Linqia's 2026 report, published September 30, 2025, found 62% raising budgets and 33% planning to spend more than $5 million.
The Hub's own series shows the trend in budget size. The share of marketers planning increases went from 58% in 2023 to 59.4% in 2024, then fell to 49.2% in 2025. The Hub's 2023 report put the 2023 reading at 67%, but only among firms that already had an influencer budget. The share putting more than 40% of marketing budgets into influencer marketing went from 23% to 24.2% to 11.9%.
Budget constraints show up most in creator fees. Rising creator costs were the top challenge in the Hub's 2026 survey, picked by 35.4% of respondents, ahead of fake engagement at 12.73%, measuring ROI at 8.70% and attribution complexity at 7.14%.
Ongoing partnerships and always-on influencer programs
Creator partnerships now run for months. The Medill Spiegel Research Center's Creator Marketing 2026 report, published August 26, 2026 with LTK, found 91% of brands run influencer programs with an always-on component: 62% hybrid and 29% fully continuous. Only 9% still run campaign by campaign.
Creators want the same thing. Aspire's survey found 63% of creators prefer long-term influencer partnerships over any other campaign type, and the Hub's 2025 report found 47% of the experts it interviewed focus on them. Influencers in Sprout Social's 2025 report asked for earlier involvement in product development, which turns a long contract into a product feedback channel.
Influencer marketing statistics: TikTok, Instagram, YouTube and social commerce adoption
Instagram still leads. The Hub's 2025 survey ranked the social media platform marketers prefer for influencer campaigns:
- Instagram: 57.1%
- TikTok: 51.6%
- YouTube: 36.7%
- Facebook: 28.4%
- LinkedIn: 11.6%
Preference and platform performance diverge. TikTok's median engagement rate is 11.2% against 1.69% on Instagram in HypeAuditor's data, so an average engagement rate quoted without a platform name tells you little. Platform volatility shows in the same Hub survey: TikTok investment intentions fell 17.2% after the threat of a US ban.
eMarketer expected 2025 to be the first year more than half of US marketers used YouTube for influencer marketing. LinkedIn's 11.6% is the clearest B2B signal in the data, and the report flags a rise in LinkedIn adoption against 2024.
The "TikTok is the most popular influencer marketing channel with 66%" claim is a misread. In the Hub's 2026 report, 66.17% is TikTok Shop's share among brands already selling through social commerce, against 13.16% for Instagram Checkout and 9.02% for YouTube Shopping. Uptake itself is thinner: 46.67% plan to test it in 2026 and 53.33% don't use it.
Aspire's numbers point the same way for ecommerce brands. 32% of brands already sell through TikTok Shop, up from 17% a year earlier, and another 25% plan to start soon. Our TikTok statistics and Instagram statistics reports cover each platform's audience in full.
Engagement rate by follower tier: nano influencers to mega accounts
Most social media influencers are small. HypeAuditor's tier chart puts 75.9% of Instagram influencers at 1,000 to 10,000 followers, which is the source of the "76% of Instagram influencers have under 10,000 followers" line. On TikTok the nano share is 88.7%, and on YouTube it's 76.1%.
Engagement falls as follower count rises, and much faster on Instagram than on TikTok. Follower count is a poor buying signal on Instagram. HypeAuditor's median engagement rate by tier, from nano influencers to mid-tier influencers and mega accounts:
| Tier | Followers | TikTok | |
|---|---|---|---|
| Nano | 1,000 to 10,000 | 1.78% | 11.6% |
| Micro | 10,000 to 50,000 | 0.54% | 9.3% |
| Mid-tier | 50,000 to 500,000 | 0.43% | 7.6% |
| Macro | 500,000 to 1 million | 0.35% | 6.8% |
| Mega | Over 1 million | 0.33% | 6.8% |
- The platform, follower tier or market to cover
- Regions, years and segments
- Where it runs: blog, white-label, gated or lead magnet
- Whose byline goes on it
- Deadline
- 2,500+ words, human-written
- Every figure linked to its source
- Yours to publish, under your name or none
- Hosting here for +$200, with your sponsored links
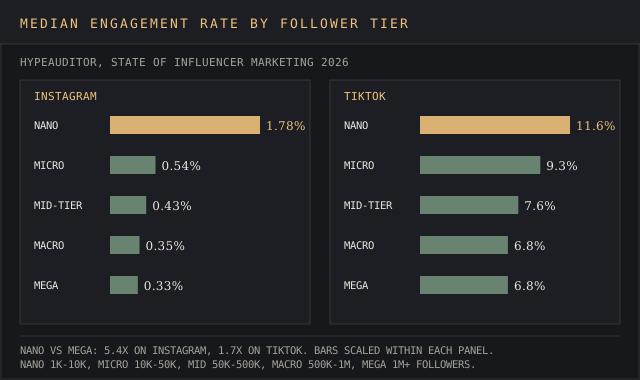
The 15.2% nano engagement figure on several stats pages doesn't trace to a current report; HypeAuditor's 2026 median is 11.6% on TikTok and 1.78% on Instagram. Across all tiers the median is 1.69% on Instagram and 11.2% on TikTok. Most influencers sit in that nano band, and strong engagement at the bottom of the ladder is why micro creators get the briefs: the per-post reach is a drop in the bucket, but the comment rate holds.
Brands mix tiers to match each target audience, pairing the reach of bigger accounts with the strong engagement of micro influencers. More than half of marketers in Aspire's survey work mainly with nano or micro accounts, 27% each, and 32% mainly with mid-tier influencers. The Hub's 2026 survey found 52.83% plan to expand work with micro creators and 51.43% with nano accounts, against 20.59% for macro.
What influencers charge per social media post
Marketplace data gives the floor. The Collabstr 2026 Influencer Marketing Report, built from more than 21,000 collaborations and 472,000 priced packages on its own marketplace, shows what influencers charge and what brands pay. Instagram is the busiest social media platform there:
| Platform | Average asking price | Average final payout | Share of 2025 collaborations |
|---|---|---|---|
| $214 | $193 | 40% | |
| TikTok | $182 | $186 | 21% |
| YouTube | $311 | $255 | 3% |
| UGC | $180 | $154 | 35% |
YouTube influencers charge the most per collaboration. Those are small-creator prices from one marketplace; mega accounts negotiate privately and can cost an arm and a leg. Aspire puts the average influencer CPM at $2.68 in 2025, down 42% on the year, and found 86% of creators will still work for free products when they like the brand.
Platform software sits on top of creator fees. Our influencer marketing platform pricing report breaks down what eight vendors charge for discovery, outreach and reporting tools.
Influencer marketing ROI and how marketers measure it
The "$5.78 for every dollar spent" figure measures earned media value. Influencer Marketing Hub's 2020 benchmark report gave it as the average per dollar spent in 2019, up from $5.20 in 2018. Earned media value is a publicity estimate, so quoting it as a sales return, as most stats pages do, is close but no cigar.
Measuring ROI is where marketers struggle. Linqia found 79% of marketers have trouble measuring it on influencer campaigns and 48% call attribution their biggest gap. The Hub's 2023 report found 74% of brands tracked sales from their influencer marketing campaigns, the origin of the "75%" line.
Many brands still measure with a code. In the 2026 benchmark, the tracking tools for influencer content were promo or discount codes at 45.9%, affiliate links at 26.0% and native shop features at 25.0%. Expectations are short: 65.9% expect payback within a month, 48.4% within two weeks. Aspire reports creators on its platform drove $52 million in attributed affiliate sales in 2025, revenue growth of 45% on the year.
Perceived effectiveness is high and slipping. 83% of respondents called influencer marketing effective in the Hub's 2023 survey, down from 90% a year earlier, and 81.2% rated it highly effective in 2025, down 3.6 points. Medill's respondents rank brand value effects first, brand sentiment at 60% and awareness at 58%, ahead of sales at 49%; 51% of marketers report campaign sales.
Creator content in paid ads against brand-directed content
Influencer content now runs as advertising. Aspire found 77% of marketers repurpose creator content in paid ads and 69% say influencer-generated content beats brand-directed content. Linqia's numbers are higher: every marketer it surveyed repurposes influencer-generated content beyond the creator's own channels, and 81% say it outperforms brand-created assets.
Brands carry that brand value into paid media. Medill found 92% of brands run creator content in social advertising, plus 52% in email, 50% in display and 36% in connected TV. Aspire found 67% build content usage rights into the first contract or rate, so the paid-media use is priced before the post goes live.
Consumer trust in influencer recommendations
Influencer content on social media drives purchases for two-thirds of consumers. Sprout Social's Q2 2026 Pulse Survey, run by Glimpse on 2,250 social media users in the US, UK and Australia between May 14 and May 20, 2026, found:
- 67% bought something on an influencer's recommendation in the past year, rising to 73% of Millennials and 81% of Gen Z consumers
- 57% trust everyday users most for product recommendations, against 9% for mega-influencers
- 21% are more likely to buy from micro-influencers, 15% from mega-influencers and 39% from either
- 21% start a product search on social media, against 53% on Google or another search engine
Sprout Social's 2025 Influencer Marketing Report, which surveyed more than 2,000 consumers, 650 marketers and 300 influencers, found 86% of consumers make a purchase inspired by an influencer at least once a year, and Sprout reports 64% say genuine reviews compel them to make a purchase.
In Sprout Social's 2025 Influencer Marketing Report, 86% of consumers make a purchase inspired by an influencer at least once a year.
Consumers who buy something inspired by an influencer each year
Source: Sprout Sociale.g. influencer-driven purchases in your country
Source: linked, checked, datedThe "69% of consumers trust influencer recommendations" figure comes from a Matter Communications survey of more than 1,000 US consumers, published February 22, 2023, and it's broader than the headline: 69% trust a friend, family member or influencer over the brand. Only 11% preferred celebrity influencers, down from 17% to 22% in Matter's 2020 survey.
That squares with Medill's brand-side data: 44% of marketers rank creators the most trusted source, against 22% for celebrities. Consumers and marketers are on the same page, with everyday accounts ranked above famous ones in every survey here.
AI in influencer strategies
AI tools are standard kit in influencer marketing efforts. The Hub's 2025 report found 60.2% of marketers use AI for influencer discovery and campaign work, 22.8% frequently, and 66.4% say it improved campaign outcomes. Aspire found 59% of marketers use AI for the same jobs: creator filtering, content prediction and performance analysis.
In the 2026 benchmark, creator discovery is the top AI use at 36.67%, AI-driven creator matching is the top focus area at 26.89%, and 13.89% use AI to develop briefs and create campaigns. Medill's 209 respondents all work at brands investing in creator marketing, and 93% of them invest in AI now. The IAB found three in four brands use it or plan to.
Creators use AI on influencer content too. HypeAuditor found 83% of Instagram influencers used AI tools for content creation in 2025. Virtual influencers haven't caught on, though: Linqia found 89% of marketers still avoid them. The jury's still out on AI-generated influencers, and the market-share figures quoted for them have no named source.
Fake followers, disclosure rules and enforcement
Fake followers are the most-reported fraud problem. In the Hub's 2026 survey, fake or bot followers made up 56.5% of reported fraud issues, ahead of fake or purchased engagement at 10.2%. That's a red flag, because the Hub's 2026 mega-influencer rates guide says 67.3% of brands still prioritize follower count when picking creators, and bought followers dilute engagement quality on every post.
US enforcement now reaches the sellers. The FTC's final rule on fake reviews and testimonials, approved 5-0 on August 14, 2024, bans selling or buying fake indicators of social media influence used for a commercial purpose, and lets the agency seek civil penalties from knowing violators.
Disclosure on social media content is governed by the FTC Endorsement Guides, revised in 2023. Labels such as "#ad" at the start of a post pass; "#ambassador" and "Gifted" alone don't, and the FTC puts responsibility on the influencer and the brand even when a platform tool such as Instagram's paid partnership label is used.
Compliance lags the rules. The UK Advertising Standards Authority's May 2025 report monitored 509 accounts from 390 influencers and found:
- 55% of likely ads on Instagram and 60% on TikTok were adequately disclosed
- 49% compliance on the 122 accounts it first checked in 2021, when 35% passed
- More than 3,500 complaints about non-disclosure in 2024, 71% about Instagram
HypeAuditor's tracking is harsher: only 6% of sponsored or sponsor-like posts in 2025 carried proper ad disclosure. It counted 5,927,075 sponsored or likely sponsored Instagram posts in the US alone, and 60% of every Instagram post tagged #ad came from creators with fewer than 50,000 followers. Brands that fly under the radar on labelling are betting the regulator's 509-account sample never lands on them.
Delivered for your site and your byline. Hosting here is optional.
Frequently asked questions
What is the 5-3-2 rule on Instagram marketing?
It's a content-mix rule of thumb for every 10 social media posts: 5 shared from other accounts, 3 of your own content and 2 personal posts. For influencer marketing it's a reminder that a feed of pure sponsorship reads as an ad channel, which matches Sprout Social's finding that 57% of consumers trust everyday users most.
What are 5 niches commonly used by influencers?
Collabstr's 2026 report ranks lifestyle, beauty, fashion, health and fitness, and travel as the five niches brands search for most on its marketplace. Matter's survey found consumers most likely to act on food and beverage (52%), health and wellness (38%) and beauty (36%) recommendations.
Is the influencer market declining?
No. Brands still fund influencer marketing campaigns at a rising rate: eMarketer expects 15.7% US growth in 2026 and the IAB expects US creator ad spend to reach $44 billion, from $37 billion in 2025. What is falling is budget concentration: brands putting over 40% of budgets into influencers fell from 24.2% to 11.9% in the Hub's data.
Is AI going to replace influencers?
The data says no for now. 83% of Instagram influencers already use AI tools to make content, per HypeAuditor, while 89% of marketers avoid virtual influencers, per Linqia. AI is replacing the vetting and matching work around creators on every social media platform faster than the creators themselves.
Bottom line
Influencer marketing statistics agree on direction and disagree on size. Every house shows growth, from eMarketer's 15.0% in the US to HypeAuditor's climb toward $31.2 billion by 2027, but the 2025 base runs from $10.52 billion to $37 billion depending on geography, scope and who's counting.
Before quoting a number, check three things: who published it, what it counts and what year it describes. The $5.78 is 2019 earned media value. The 76% counts Instagram influencers by follower band. The $22 billion Instagram figure is a whole-industry estimate with a new label.
Budgets are moving toward always-on influencer partnerships with smaller accounts, nano and micro influencers above all. An average engagement rate means little without a platform and a tier attached: 1.78% is a strong Instagram nano figure and a weak TikTok one.
For the platform side of the same money, see our social media statistics, YouTube statistics and Sprout Social review.
Influencer platforms, agencies and social commerce brands publish reports like this one as lead magnets and pitch decks.
A report on your topic for a blog page, gated content or a lead magnet.
Written for your client and published under their brand, with my name left off.
Your report on marketintelligencetools.com, with 2 to 3 CTAs carrying your sponsored links.
Default terms: the report is yours to publish, and I keep the right to republish it on this site behind a gate, outside Google's index.
The research houses, vendor surveys and regulators behind each influencer marketing figure, and which ones sell to the industry they measure
Industry size: influencermarketinghub.com (2025 report; Benchmark Reports for 2020, 2023 and 2026; mega-influencer rates guide), hypeauditor.com (State of Influencer Marketing 2026), emarketer.com (March 2025 forecast), iab.com (2025 creator economy ad spend report, 20 November 2025), grandviewresearch.com (influencer marketing platform market, June 2026) and goldmansachs.com (creator economy research).
Marketer and creator surveys: aspire.io (State of Influencer Marketing 2026 and its stats page), linqia.com (2026 State of Influencer Marketing, 30 September 2025), spiegel.medill.northwestern.edu (Creator Marketing 2026, 26 August 2026) and collabstr.com (2026 Influencer Marketing Report).
Consumer surveys: media.sproutsocial.com (Q2 2026 Pulse Survey), sproutsocial.com (2025 Influencer Marketing Report) and matternow.com (22 February 2023). Rules and enforcement: ftc.gov (final rule on fake reviews, 14 August 2024; Endorsement Guides) and asa.org.uk (influencer ad disclosure report, May 2025).
Every figure was checked against its source on 17 October 2026. Influencer Marketing Hub, HypeAuditor, Aspire, Linqia, Collabstr and Sprout Social all sell to brands running influencer programs, so their surveys are labelled as vendor surveys, and no regulator or statistics office publishes a size for the industry.