Women in the workforce statistics: 2026 participation, pay and leadership data
 By Jan Suski. I go deep on every review, checking every number against its source and digging up details other coverage misses, a habit from six years of SEO and link building for tech companies. Bylines at Brand24 and Senuto. How the scoring works.
Women's labor force participation stood at 56.9% in October 2026, seasonally adjusted, according to the Bureau of Labor Statistics (BLS), the Department of Labor's statistics agency. That's three points under the all-time peak of 60.0% set in 1999, and it means 81.1 million women were working or looking for work. Women also held 50.1% of all nonfarm payroll jobs the same month.
This report collects the women in the workforce statistics that matter for a hiring plan, a pay audit or a market sizing exercise: participation, labor force status, earnings, industry and occupation mix, leadership share and the global picture. Every figure links to the agency or research house that published it, and the information under each table names the survey type behind it. All of it is secondary data, so the survey and the month matter as much as the number.
It's written for analysts, HR and recruitment teams, and anyone who needs to quote a number and defend it. The figures move monthly, so each one carries its reference period.
The numbers US labor force, pay and leadership, checked November 2026
Women hold half of all payroll jobs but only 47% of labor force slots, because the two surveys count different things: the payroll survey counts jobs and skips the self-employed, while the labor force counts each person once.
The pay ratio has climbed 21 points since 1979, yet a full-time woman still takes home $225 less per week than a full-time man.
Representation thins at every rung: 49% of entry-level corporate staff are women, against 29% of the C-suite and 11% of Fortune 500 CEOs.
I'll write a 2,500+ word report on the market you name, with BLS, census and research house figures sourced and dated. Yours to publish, from $200.
Labor force participation: from 32.7% in 1948 to a 1999 peak
In 1948, the first year of the series BLS created for the modern household survey, 32.7% of women aged 16 and over were in the labor force, against 86.6% of men (BLS series LNS11300002 via FRED). Women's participation climbed for five straight decades and peaked at 60.0% in 1999, as the BLS women in the labor force page records.
The decline after 1999 sped up during the December 2007 to June 2009 recession and leveled off around 2014. In 2014, the BLS counted 57.0% of women in the labor force and women made up 46.8% of it. The pandemic then knocked participation down for both women and men in 2020, with the rebound starting in 2022.
The 2025 annual average put women's participation at 57.3% and men's at 67.8% (CPS table 2). The monthly reading slipped to 56.9% by October 2026. An aging population pulls the rate down on its own, since retirees count in the denominator, so the long slide since 1999 isn't purely a story of women leaving work.
- 1948: 32.7% of women in the labor force
- 1999: 60.0%, the all-time peak
- 2014: 57.0%, after the post-recession slide
- 2025: 57.3%, annual average
- October 2026: 56.9%, seasonally adjusted
Women and men labor force status, October 2026
The monthly Employment Situation release is the freshest source for the labor force status of women. The table below uses the seasonally adjusted figures from table A-1, which BLS publishes for women and men 20 and over and for all women 16 and over.
| Group (seasonally adjusted, Oct 2026) | Participation rate | Employment-population ratio | Unemployment rate | Labor force |
|---|---|---|---|---|
| Women, 16+ | 56.9% | 54.6% | 4.0% | 81.1 million |
| Women, 20+ | 58.1% | 56.0% | 3.6% | 77.9 million |
| Men, 20+ | 69.6% | 66.9% | 3.9% | 86.4 million |
Copy these lines into an email, fill them in and send. I reply with scope and a price within 2 to 3 business days.
Open the emailSource: BLS Employment Situation, table A-1. The women and men labor force status table above shows adult women with a lower unemployment rate than adult men, 3.6% against 3.9%, while trailing them by 11.5 points on participation.
Month-to-month moves of a tenth of a point rarely clear the bar for a statistically significant change in the household survey, and BLS flags in each release which changes are statistically significant.
Between June and October 2026, women's participation moved between 56.4% and 56.9%, so treat any single month as noise and read the trend across a quarter. The devil's in the details with labor statistics: a headline "jump" can sit inside the margin of error. Keep an eye on the employment-population ratio alongside it, since it moved in step, from 54.4% to 54.6%.
One gap in the labor statistics matters for anyone building a time line, whatever the age or race cut. October 2025 data were never collected because of the federal government shutdown, so BLS computes 2025 annual averages from 11 months.
Mothers, marital status and the childcare effect
Children account for much of the participation gap. In 2025, 73.9% of mothers with children under 18 were in the labor force, against 93.7% of fathers, according to BLS's Economics Daily.
- Mothers whose youngest child is under 6: 68.0%
- Mothers whose youngest child is 6 to 17: 78.2%
- Fathers whose youngest child is under 6: 95.3%
- Fathers whose youngest child is 6 to 17: 92.5%
The 10-point jump once the youngest child reaches school age, a jump that lines up with school hours, points at childcare and caregiving as the constraint. The same pull shows in absence data: BLS put women's absence rate at 4.0% against 2.6% for men in 2025, per our absenteeism rate benchmarks.
The Bureau of Labor Statistics families release breaks these rates out further by marital status, and single mothers have historically posted higher participation than married mothers. Read between the lines of the age split and the lion's share of the gender participation gap sits with mothers of preschool children.
Race, ethnicity and demographic characteristics
Participation and unemployment differ by race and ethnicity, and by age within each race and ethnicity group, and the differences run in directions that surprise people who only read the headline rate. These are 2025 annual averages from CPS table 3 and CPS table 4.
| Group, 2025 | Women: participation | Women: unemployment | Men: participation | Men: unemployment |
|---|---|---|---|---|
| White | 56.5% | 3.6% | 67.6% | 3.9% |
| Black or African American | 59.6% | 6.7% | 65.8% | 7.1% |
| Asian | 58.8% | 3.6% | 72.9% | 3.6% |
| Hispanic or Latino | 59.5% | 5.2% | 74.7% | 5.0% |
By race, Black women posted the highest participation of any group of women in 2025, and also the highest unemployment. Their employment-population ratio fell from 59.3% in February 2025 to 57.3% by August 2025, a decline the Economic Policy Institute found concentrated among Black women and absent among Black men or other groups of women.
That analysis is the clearest reason not to read a single race or ethnicity figure without its trend, and the same care applies to any demographic market segmentation built on these tables.
Educational attainment cuts the other way from pay. In 2024, 49.0% of employed women aged 25 and over held a bachelor's degree or higher, against 41.3% of employed men, per the BLS Women in the Labor Force databook. Among women aged 25 to 34 the share was 52.4%.
Full time, part time and hours worked
Part time work is where women's labor force participation looks most different from men's. In 2025, 17.8 million women usually worked part time, 23.1% of the 76.9 million employed women. Among men, 10.8 million of 86.6 million worked part time, about 12.4% (CPS table 8).
- Women made up 62.3% of all part time workers in 2025 (17.8 of 28.6 million)
- 59.1 million women worked full time, against 75.8 million men
- BLS counts anyone working fewer than 35 hours a week as part time
Hours are the elephant in the room for every pay comparison below. BLS's headline earnings ratio covers full time workers only, so it leaves out the women most likely to be earning less per year.
Earnings: what women earn compared with men
In the third quarter of 2026, women working full time had median usual weekly earnings of $1,127, against $1,352 for men, per BLS Usual Weekly Earnings. That's a ratio of 83.4%, computed from the two published medians.
The ratio was 62.3% in 1979, the first year comparable data exist, according to the BLS Highlights of Women's Earnings in 2024. The same report put the 2024 ratio at 82.7%, with women at $1,043 a week and men at $1,261. A 0.7-point gain in two years makes full parity by 2030 a long shot.
| Group | Women's weekly median | Men's weekly median | Ratio |
|---|---|---|---|
| All full time, Q3 2026 | $1,127 | $1,352 | 83.4% |
| White, Q3 2026 | $1,137 | $1,394 | 81.6% |
| Black, Q3 2026 | $994 | $1,040 | 95.6% |
| Asian, Q3 2026 | $1,506 | $1,841 | 81.8% |
| Hispanic, Q3 2026 | $919 | $1,028 | 89.4% |
| Ages 25 to 34, 2024 | $1,023 | $1,158 | 88.3% |
| Ages 55 to 64, 2024 | $1,088 | $1,421 | 76.6% |
| Bachelor's degree and higher, 2024 | $1,479 | $1,907 | 77.6% |
Our analysis of the table shows two patterns. The gap is narrow for young workers and wide for workers in their late 50s, which tracks career interruptions around childbearing. And the narrowest ratios by race and ethnicity come from groups where men's earnings are lowest, so a 95.6% ratio for Black workers says as much about Black men's pay as Black women's.
Globally, the ILO reports that women employees earn an average of 78 cents for every dollar paid to male employees, and that women received 52.4% of men's total labor income in 2025.
Industry and occupation: where women work
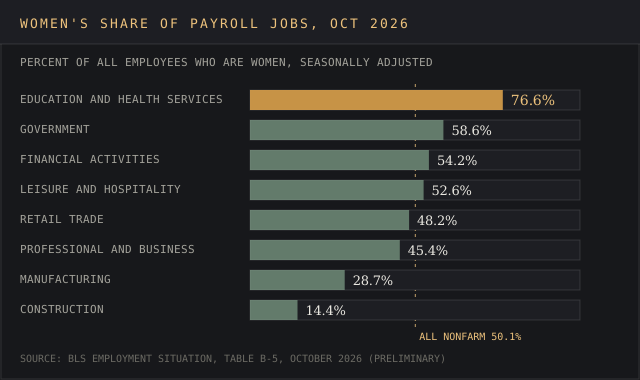
The payroll survey shows how unevenly women are spread across the economy. In October 2026, women held 76.6% of jobs in private education and health services and 14.4% in construction (BLS table B-5).
Want an industry share chart like this for your sector? Send the industry and the years.
Email a brief| Industry, Oct 2026 | Women employees | Women's share |
|---|---|---|
| Private education and health services | 21.5 million | 76.6% |
| Government | 13.7 million | 58.6% |
| Financial activities | 4.9 million | 54.2% |
| Leisure and hospitality | 8.9 million | 52.6% |
| Retail trade | 7.5 million | 48.2% |
| Professional and business services | 10.3 million | 45.4% |
| Manufacturing | 3.6 million | 28.7% |
| Construction | 1.2 million | 14.4% |
By occupation, 30.3% of employed women worked in professional and related jobs in 2024, against 20.0% of men, per the BLS databook. Women held 11.4% of their jobs in management occupations, against 14.1% for men. Service occupations took 20.0% of women's employment and natural resources and construction just 1.1%.
Recruiters tracking these splits by region can pair them with the sources in our labor market intelligence guide and the hiring data covered under recruitment market intelligence. Our remote work statistics, freelance statistics and employee engagement statistics reports cover how and where that work happens.
Women in leadership statistics
McKinsey and LeanIn.Org's Women in the Workplace 2025 tracked pipeline data from 124 US and Canadian companies. Women made up 49% of entry-level staff, 42% of managers, 39% of senior managers and directors, 35% of vice presidents, 32% of senior vice presidents and 29% of the C-suite. The C-suite share was unchanged from 2024.
The same study found 93 women promoted to manager for every 100 men, falling to 74 for women of color. That first promotion is the broken rung, and once a company misses the boat there it rarely catches up at the senior levels.
- Fortune 500 CEOs: a record 55 women, 11% of the 2026 list (Fortune)
- Fortune Global 500 CEOs: a record 34 women, 6.8% (Fortune)
- Managerial positions worldwide: 30.5% held by women in 2025, up from 26.9% in 2015 (ILO)
The status of women in leadership, and the status of women on corporate boards, is the area where the record keeps being broken by a single seat at a time. Fortune counted 55 female CEOs in June 2025 too, then 52 by December 2025, before 55 again on the 2026 list. Par for the course for a number this small: one retirement moves it a full point.
The global status of women at work
Women account for 40.1% of global employment in 2025, according to the ILO, well under the 47.0% share women hold in the US labor force. The World Bank republishes the ILO's estimates of the female share of each country's labor force for 1990 through 2025.
Women account for 40.1% of global employment in 2025, according to the ILO, against a 47.0% share of the US labor force.
Women's share of global employment in 2025
Source: ILOe.g. women's share of employment in your country
Source: linked, checked, datedThe World Economic Forum's Global Gender Gap Report 2026 put the global gap at 69.2% closed across 145 economies, up from 68.8% in 2025, and estimated full parity is 120 years away. Iceland ranked first for the 17th year running with 93% of its gap closed. Chad ranked last, with Iran and Pakistan also in the bottom three.
Why the published estimates disagree
Search "women percentage of workforce" and you'll get 46.8%, 47%, 50.1% and 41% from respectable sources. Each one measures something different, and the right one depends on which survey produced it. Checking that is basic source credibility work.
- Share of the labor force (47.0%). The household survey, the Current Population Survey, counting people working or looking for work. The Women's Bureau at the Department of Labor publishes a Current Population Survey graphic built on this series.
- Share of payroll jobs (50.1%). The establishment survey, counting jobs. A person with two part time jobs counts twice.
- Labor force participation rate (56.9%). The share of all women 16 and over who are in the labor force, retirees and students included in the base.
- Global share of employment (40.1%). ILO modelled estimates across every country.
- 46.8%. The 2014 labor force share, still quoted on pages that haven't updated their BLS data in a decade.
Each Current Population Survey graphic you'll find online should state its series too. Seasonally adjusted and unadjusted series also diverge by a few tenths in any given month. If a page doesn't say which series it uses, assume it's mixing them.
Delivered for your site and your byline. Hosting here is optional.
Frequently asked questions
What percentage of the workforce is women?
Women were 47.0% of the US civilian labor force in 2025 and held 50.1% of nonfarm payroll jobs in October 2026. Both figures come from BLS; the gap between them comes from people holding multiple jobs.
Are women 50% of the workforce?
Of payroll jobs, yes: 50.1% in October 2026. Of the labor force, no: 47.0% in 2025, because the labor force counts each person once.
Do women make 80% of what men make?
Among full time workers, women earned 83.4% of men's median weekly pay in Q3 2026. The ratio is lower for women 55 to 64 (76.6% in 2024) and for women with a bachelor's degree (77.6%).
Are there 300,000 Black women out of work?
The figure circulated in mid-2025 after BLS data showed Black women's employment dropping. EPI's analysis questioned the 300,000 count but confirmed the decline: Black women's employment-population ratio fell from 59.3% in February 2025 to 57.3% in August 2025.
What is the percentage of women in leadership?
Women held 29% of C-suite roles in McKinsey's 2025 study, 11% of Fortune 500 CEO seats in 2026 and 30.5% of managerial positions worldwide in 2025.
What are the five C's of women's work?
Caring, cashiering, catering, cleaning and clerical work, a shorthand for the occupations where women's employment has historically been concentrated. The payroll data above still shows the pattern, with women holding 76.6% of education and health jobs.
Which country has the highest gender gap?
Chad ranked last of 145 economies in the WEF Global Gender Gap Index 2026. Iceland had the smallest gap, at 93% closed.
Bottom line
Women's participation in the US labor force sits near 57%, three points off its 1999 peak, with mothers of young children accounting for most of the gap with men. Bureau of Labor Statistics data show women hold half of all payroll jobs and earn 83 cents on the male dollar among full time workers, up from 62 cents in 1979.
The leadership numbers move slowest: 29% of the C-suite and 11% of Fortune 500 CEOs. For anyone citing these women in the workforce statistics, the rule is simple: name the survey, the month and the seasonal adjustment, because each of those choices changes the answer.
HR software vendors, recruiters and DEI consultancies use reports like this one in pitches, client decks and budget calls.
A report on your topic for a blog page, gated content or a lead magnet.
Written for your client and published under their brand, with my name left off.
Your report on marketintelligencetools.com, with 2 to 3 CTAs carrying your sponsored links.
Default terms: the report is yours to publish, and I keep the right to republish it on this site behind a gate, outside Google's index.
Who published each workforce figure, and what the surveys leave out
Participation, labor force, unemployment and part-time figures are Bureau of Labor Statistics data: the Employment Situation release for October 2026 (tables A-1, A-10 and B-5) and Current Population Survey annual tables 2, 3, 4 and 8 for 2025, which BLS computed from 11 months because October 2025 was never collected. Historical rates are BLS series LNS11300002 via FRED and the BLS women in the labor force page, last modified 3 March 2026.
Earnings are BLS Usual Weekly Earnings for the third quarter of 2026 and Highlights of Women's Earnings in 2024 (January 2026). Mothers' participation is The Economics Daily of 1 May 2026. Occupations and education come from Women in the Labor Force: A Databook (March 2026).
Leadership figures are McKinsey and LeanIn.Org's Women in the Workplace 2025 (December 2025) and Fortune's June and August 2026 lists. Global figures are the ILO's ten-year review and the World Economic Forum's Global Gender Gap Report 2026 (16 September 2026).
The Black women employment trend is the Economic Policy Institute's 2025 analysis. Every figure was checked in November 2026. No US agency publishes a monthly leadership share, and BLS does not publish a women-owned business count.