Gig economy stats 2026: 7.4% of US workers by one count, 38% by another
 By Jan Suski. I go deep on every review, checking every number against its source and digging up details other coverage misses, a habit from six years of SEO and link building for tech companies. Bylines at Brand24 and Senuto. How the scoring works.
The numbers US and global gig work, checked 20 November 2026
The federal count of independent contractors rose from 6.9% to 7.4% of employment between 2017 and 2023, so the gig workforce is growing slowly on the strictest definition.
Contractors in ADP's payroll data earn $10 more an hour at the median than temps, so "gig workers" covers two labor markets with different pay.
Published market sizes for 2025 and 2026 run from $230.52 billion to $674.13 billion, which makes any single global gig economy figure a choice of definition.
I'll write a 2,500+ word report on the market you name, with federal surveys, platform filings and research house figures linked to their sources. Yours to publish, from $200.
The Bureau of Labor Statistics counts 11.9 million independent contractors, 7.4% of total employment, in its July 2023 Contingent Worker Supplement, released 8 November 2024. Upwork's Freelance Forward 2023 survey puts the freelance workforce at 64 million people, 38% of US workers. Both are accurate, and the devil's in the details of what each one counts.
That gap runs through every set of gig economy statistics published. A government survey counts the primary job a person held. A platform survey counts anyone who earned a dollar outside a payroll in the past year. A market forecast counts revenue, and the six houses below disagree by a factor of 30.
This page collects the key gig economy statistics that trace to a named publisher: how many gig workers there are, what they're paid per hour, who they are, what benefits they lack, and how big the global gig economy market is on each house's count.
It's written for HR and workforce planners at companies hiring independent workers, labor market analysts and anyone checking a headline figure against its source. The figures matter because the definition you pick moves a headcount plan or a policy cost estimate by tens of millions of workers.
How many gig workers are there in the US
How many gig workers you find depends on the question asked. The Gig Economy Data Hub, run by The Workers Lab, puts the share of US workers doing some form of non-standard work at 25% to 43% across private surveys, which it converts to at least 42 million people. The federal surveys land far lower, because they record each person's primary job.
| Count | Share | Definition | Source, date |
|---|---|---|---|
| Contingent workers | 4.3% | Jobs not expected to last, main job | BLS CWS, July 2023 |
| Independent contractors | 7.4% | Main job as contractor, consultant or freelancer | BLS CWS, July 2023 |
| Platform tasks | 4% | Adults doing short-term tasks through an app or website, prior month | Federal Reserve SHED, 2024 |
| Any gig activity | 20% | Adults selling, renting or doing tasks for pay, prior month | Federal Reserve SHED, 2024 |
| Some gig work in a year | About 25% | Workers paid as short-term W-2 or 1099 at any point in 12 months | ADP payroll data, 2024 |
| Freelancing in the year | 38% | Working adults who did any freelance work, self-reported | Upwork, 2023 |
Copy these lines into an email, fill them in and send. I reply with scope and a price within 2 to 3 business days.
Open the email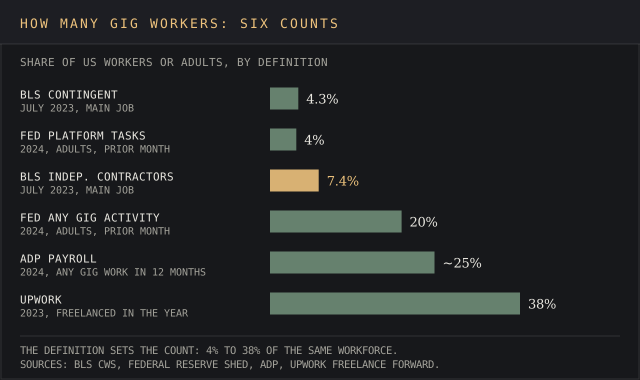
The Bureau of Labor Statistics is the primary source on alternative work arrangements in the US. Its July 2023 supplement counted:
- 11.9 million independent contractors, 7.4% of total employment, up from 6.9% in May 2017
- 2.8 million on-call workers, 1.7%
- 945,000 temporary help agency workers, 0.6%
- 862,000 workers provided by contract firms, 0.5%
- 6.9 million contingent workers, 4.3% of employed people, up from 3.8% in 2017
The four arrangements sum to 10.2% of employment, our own addition of the BLS shares. That matches the 10.2% the Data Hub reports for workers relying on gig work as their main source of work. The supplement runs on the Current Population Survey, which records the job held in the survey's past week, so a nurse who drives for a delivery app on Sundays counts under her full time job.
Private surveys count that nurse too. Upwork's survey, fielded October to November 2023 by Edelman Data & Intelligence across 3,000 working adults, found 64 million Americans freelancing in 2023, up from 60 million in 2022. Upwork puts their contribution to the US economy at $1.27 trillion in annual earnings.
Those freelancers include millions of employees with a side gig as well as millions of full-time independent workers paid by the project. MBO Partners reports a record 74.9 million Americans earning income independently in its 2026 State of Independence series, and says full-time independent status is up 114% over its 16 years of tracking.
For employer planning the split matters. A company hiring 1099 independent workers through gig platforms buys from a different labor market than one booking temps through an agency, and each count captures a different slice.
Payroll data adds a third angle. ADP's gig economy study, working from payroll records for more than 24 million people, found short-term W-2 employees held 8% of filled jobs in 2024 and 1099 contractors held 1.8%, nearly 10% combined.
About 1 in 10 workers were in the gig economy in a typical month, and 1 in 4 had done some gig work over 12 months. Contractors rose from 1.4% of total employment in 2019 to 1.8% in 2024, and the average monthly contractor count grew from about 300,000 to over 450,000, a 50% increase.
Gig work as a primary income source
Most gig work is a side job. The question that matters for policy is how many people live on it, and the published shares run from 10% to 37%.
- 10.2% of workers rely on gig work for their primary income, about 17.4 million people, a share the Data Hub calls stable since 2017 (BLS CWS)
- 10.4% do freelancing full time on their own definition, per the Freelancers Union "Freelancing in America" survey, and 11% by MBO Partners' 15-hours-a-week cutoff (both via the Data Hub)
- 21% of adults doing gig activities called it their main job (Federal Reserve, 2024)
- 37% of gig workers rely on it as their primary income, rising to 55% among millennials (TransUnion, October 2024)
TransUnion's figure comes from 1,013 adults surveyed in August 2024 with Toluna, unweighted, with a margin of error of plus or minus 3.1 points. The same survey found over 60% of gig workers take part to supplement their income, so extra income takes the lion's share of reasons on its own data.
Two-thirds of TransUnion's gig workers report earnings under $2,500 a month. That leaves millions of households using gig work as a top-up, and about 17.4 million people treating it as their primary income. The federal figure is the better base for planning.
The Fed found 96% of gig workers usually spend under 35 hours a week on gigs and 70% spend under five. Only 51% of people doing gig activities held a non-gig primary job, against 57% of adults with no gig activity, and 28% of gig workers said they did no work for pay in the prior month at all.
What gig workers earn per hour and per month
ADP's 2024 payroll data splits the gig workforce into two pay ladders, and the gap between them is wide enough that any single average misses the mark.
| Measure, 2024 | Independent contractors | Temps (short-term W-2) | Traditional W-2 employees |
|---|---|---|---|
| Median pay per hour | $25 | $15 | $23 (all US workers) |
| Mean hourly pay | Nearly $39 | $19 | $34 |
| Monthly earnings | About $1,620 | About $860 | About $2,620 (full time) |
| Hours per month | 85 | 88 | 155 |
| Share earning over $100 an hour | About 7% | Under 10% earn over $39 | 4.5% |
The top earners sit with the contractors: about 7% of them clear $100 per hour, against 4.5% of traditional employees. More than 90% of temps earn under $39 an hour. Temps carry 3.2% of total wages from 8% of jobs, and contractors carry 0.4% of total pay from 1.8% of workers.
Freelancers and contractors also lack access to overtime pay and paid leave, so the hourly gap understates the total. Weekly pay from the federal survey confirms the order.
Full-time independent contractors earned a median $949 a week in July 2023, against $1,132 for workers in traditional employment and $818 for temp agency workers. No federal survey publishes an average annual pay figure for gig workers; $949 across 52 weeks comes to about $49,350, our own multiplication.
At the top, MBO Partners reports almost 6 million independent workers earning more than $100,000 a year. Chasing the $108,028 average freelancer income quoted across statistics roundups was a wild goose chase: it traces to no survey we could find, so it isn't used here.
The gender pay gap in gig work
ADP measured the hourly gender pay gap at 22.5% for traditional W-2 employees, 11.4% for temps and 4.5% for independent contractors. Hours run the same direction: male temps averaged 96 hours a month against 82 for women, a 17% gap. The gender pay gap narrows as work moves off the payroll, and contractors come closest to a level playing field at 4.5%.
Who does gig work: age, gender and Gen Z
Gig workers skew young at the temp end and old at the contractor end, and they skew male across both.
- Gender: 71% of independent contractors in ADP data are men (2024). BLS found 8.7% of employed men and 5.8% of women working as contractors.
- Under 30: more than 43% of temps were under 30 in 2024 (ADP). The Fed found 26% of adults aged 18 to 29 did gig activities, the highest of any age band.
- Gen Z and millennials: Gen Z made up 15% of freelancers in 2023 and millennials, then aged roughly 27 to 42, made up 45%. 52% of Gen Z professionals were freelancing (Upwork).
- Older workers: 7.2% of contractors are 70 or older, against 3.8% of the total workforce (ADP). Workers 55 and older make up 36% of independent contractors (BLS).
The baby boomers in that last group work the longest gigs: ADP's contractors aged 70 and over average 110 hours a month. The Fed adds that 30% of students did gig work against 19% of non-students, and 26% of parents of children under 13.
In online freelancing, women make up about 39% of labor supply, per the Oxford Internet Institute's Online Labour Index in its 2020 edition, peaking at 41% in the US and falling to 28% in India.
Hours, benefits and financial security
Independent contractors average 85 hours a month in ADP's data, about half the 155 that traditional employees work. Full time employees in ADP's data typically log 150 to 175 hours. The report found 28% of contractors work under 40 hours, more than half work fewer than 90, and nearly 14% work over 180.
Benefits are where gig workers bite the bullet, starting with access to an employer health plan. Leaving traditional employment means contractors get no employer health or retirement plan, and they're paid with no paid leave attached. The federal numbers show the gap:
- 74.2% of independent contractors had health insurance from any source in July 2023, against 84.9% of workers in traditional arrangements (BLS)
- Only 16.6% of temp agency workers had employer-provided coverage, against 54.4% in traditional jobs (BLS)
- 28% of gig workers wish they had access to benefits such as health insurance (Fed)
- 49% wish their pay were more consistent, the significant challenge in the Fed's data
Inconsistent earnings show up in household finances. Half of gig workers have three months of expenses saved, against 56% of adults with no gig activity, and 35% say they're worse off than a year earlier against 27% (Fed, 2024). 31% say they'd have trouble making ends meet without gig income. The widely repeated claim that 80% of full-time gig workers can't cover a $1,000 expense has no source we could trace, so the Fed's savings measure stands in for it here.
Why people take gig work, and job satisfaction
Flexibility is the draw on every survey. Among adults doing gig activities in 2024, the Fed found:
- 61% value calling the shots as their own boss
- 55% value flexible hours, rising to 78% for platform tasks
- 35% say gig work gives them work life balance
Job satisfaction runs high where people chose the arrangement. BLS found 80.3% of independent contractors preferred their arrangement and 8.3% would prefer a traditional job. Contingent workers split the other way, with 44.8% preferring a permanent job. TransUnion found 64% satisfied with gig platform work to some degree, and flexibility led the reasons at 71%.
Global gig economy market size: six houses, six answers
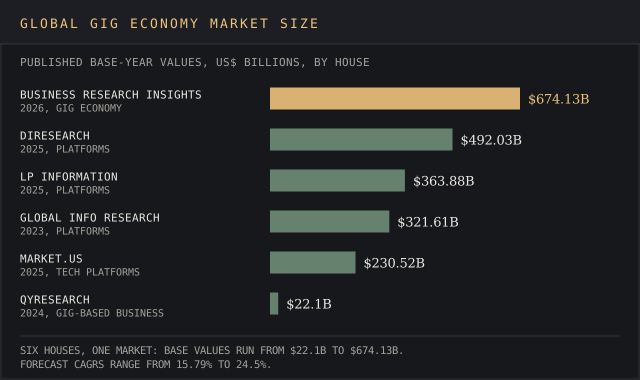
The global gig economy market has no agreed size, and the houses aren't on the same page about what it includes. Analyst firms define the market as platform revenue, gross transaction value or business revenue, and their 2025 and 2026 values span almost three times from top to bottom before the outlier.
| House | Market as defined | Base value | Forecast | CAGR |
|---|---|---|---|---|
| Business Research Insights (Oct 2026) | Gig economy | $674.13B (2026) | $2,522.37B (2035) | 15.79% |
| DIResearch | Gig economy platforms | $492.03B (2025) | $2,267.19B (2032) | 24.39% |
| LP Information (Jan 2025) | Gig economy platforms | $363.88B (2025) | $1,354.61B (2031) | 24.5% |
| Global Info Research | Gig economy platforms | $321.61B (2023) | $1,328.96B (2030) | 23.1% |
| Market.us | Gig economy tech platforms | $230.52B (2025) | $1,012.55B (2035) | 15.95% |
| QYResearch | Gig-based business | $22.1B (2024) | $64.13B (2031) | 17.0% |
Want a market size chart like this for your own sector? Send the market and the research houses to compare.
Email a briefThree reasons drive the spread. The first is scope: QYResearch sizes gig-based businesses, while the platform reports count the transaction value flowing through gig platforms, and the October 2026 report at the top of the table sizes the whole gig economy.
The second is growth math. Forecast CAGRs run from 15.79% to 24.5%, and over a decade that gap alone doubles the end value. The top report's 15.79% a year from 2026 to 2035 is what carries $674.13 billion to $2,522.37 billion. The third is unit hygiene: that top report's own chart is labelled in millions while its text says billions.
Regional shares come from one house only. The same October 2026 report gives North America about 35% of the global gig economy, Asia-Pacific 27%, Europe 24%, and the Middle East and Africa about 7%. None of these forecasts publishes enough method to serve as a strong foundation for a budget, so read each one as that house's definition of the market, and none of the figures is set in stone.
The global gig workforce and where it lives
The World Bank's July 2023 report estimates 154 million to 435 million online gig workers worldwide, 4.4% to 12.5% of the global labor force. The low figure counts unique registered workers found by web scraping; the high one adds workers for whom gig work is secondary or marginal.
Its definition covers online freelancing and micro-tasking, and it notes that workers without internet access or a device are shut out of the gig economy online. The bank found demand for online gig workers rising faster in developing countries than in industrialized ones.
On supply, India led the July 2017 snapshot by Oxford Internet Institute researchers with 24% of online freelancers, followed by Bangladesh at 16% and the United States at 12%. Demand runs the other way: US employers posted 51% of online vacancies in the institute's first Online Labour Index map. The US buys the most gig services online, India supplies the most freelancers, and Asia-based workers made up about 60% of the online freelancers the index observed.
Gig platforms, AI and demand for specialized skills
Gig platforms report the market from the inside, with access to every transaction. Upwork's third-quarter 2025 results showed AI-related work on a roll, with gross services volume up 53% year over year, against 30% in the second quarter, while active clients fell 7% to 794,000.
Upwork's AI-related work grew 53% year over year in the third quarter of 2025, against 30% in the second quarter, per Upwork's third-quarter 2025 results.
Growth in Upwork's AI-related work, Q3 2025, year over year
Source: Upwork third-quarter 2025 resultse.g. volume at the marketplaces your clients hire through
Source: linked, checked, datedClients pay for access to specialized skills by the project, and demand is moving there faster than the client base is growing. The 109% jump in demand for AI-tagged freelance skills quoted in statistics roundups has no platform release behind it; Upwork's 53% is the reported figure.
Upwork's own survey found 47% of freelancers provide knowledge services such as programming, marketing, IT and business consulting, the skilled end of freelancing, and MBO Partners counts nearly 12 million independent service professionals. The consultants and professionals at that end of the gig workforce are the 7% earning over $100 an hour in ADP's data.
The local, physical end shows in Census data. The Census Bureau's 2023 Nonemployer Statistics counted 1,430,708 courier and messenger services proprietorships, most of them paid per delivery, and 1,355,360 taxi and limousine proprietorships, up from 1,179,167 in 2018. Taxi and limousine receipts rose from $24.6 billion to $39.9 billion over those five years. Individual proprietors in the gig-related industries took in about $152.6 billion in 2023.
Enterprise buyers see gig talent as workforce flexibility. MBO Partners reports 54% of enterprises expect AI to raise their use of independent talent over the next two years, and 81% of executives at leading-edge organizations strongly agree independent talent gives access to high-value skills.
Its survey behind that figure covered 84 executives, so treat it as a direction. On the worker side, MBO Partners says 78% of independents plan to stay independent or build larger businesses in the future.
What the surveys and forecasts leave out
Forecasts in this field have a habit of jumping the gun. Upwork and the Freelancers Union's Freelancing in America 2017 projected freelancing would become the majority arrangement in the US workforce by 2027, 86.5 million against 83.4 million non-freelancers. Upwork's 2023 count stood at 64 million and 38% of the total workforce, so that projection about the future of freelancing is a long shot with a year to go.
Four gaps run through the data:
- The federal survey is irregular. BLS ran the supplement in 2005, 2017 and 2023, so the labor force share of contractors has three points on a chart.
- Short term jobs on apps are small and hard to see. The Fed's 4% doing platform tasks is the best current read, and earlier estimates sat near 1% (BLS 2017) to 1.6% (JPMorgan Chase Institute, 2018).
- Private surveys tend to come from platforms and companies selling to freelancers. Upwork, MBO Partners and TransUnion sell to the market they measure, and each publishes its sample.
- Selling counts as gig work in some surveys. 14% of adults sold or rented items in the Fed's count, the largest slice of its 20%.
The Data Hub sums up the problem for millions of workers who fall between definitions: "Gig work requires new ways of measuring work." Until BLS runs the supplement on a fixed schedule, the jury's still out: every count of how many gig workers exist is a snapshot, and the honest number is a range.
Delivered for your site and your byline. Hosting here is optional.
Frequently asked questions
Is the gig economy declining?
No, on the federal data. Independent contractors rose from 6.9% to 7.4% of employment between 2017 and 2023 (BLS), and ADP counted 50% more monthly contractors at the end of 2024 than in 2019. Platform client counts are softer: Upwork's active clients fell 7% in the year to September 2025 while AI work grew.
What are the statistics for the gig economy in 2026?
The latest figures put 20% of US adults in some gig activity in a given month (Fed, 2024), 7.4% of workers in independent contracting as their primary work (BLS, 2023) and 74.9 million independent workers in the US (MBO Partners, 2026). The global gig economy market is $674.13 billion in 2026 on Business Research Insights' count.
What percent of Americans work in the gig economy?
Between 7.4% and 38%, depending on the definition. The low end is independent contracting as a main job (BLS). The Fed's 20% counts any gig activity in the prior month, and Upwork's 38% counts freelancers who did any paid project during 2023.
Which country has the biggest gig economy?
The United States buys the most: it posted 51% of online vacancies in the Oxford Internet Institute's index and holds about 35% of the global market on the largest published forecast's split. India supplies the most online workers, 24% in the institute's July 2017 snapshot.
Bottom line
The gig economy is a set of overlapping workforces, and each source measures a different one. Federal data puts independent contractors at 7.4% of employment and alternative arrangements at about 10% of primary jobs. Surveys of anyone with side income put participation at 20% to 38%, which is tens of millions of extra workers and millions of freelancers paid outside a payroll.
Pay splits along the same line. Contractors earn a $25 hourly median with about 7% above $100, temps earn $15, and both work about half the hours of full time employees without employer benefits. For planning, start from the BLS and Fed figures and treat platform surveys and market forecasts as each publisher's own definition of the market.
Staffing firms, freelance platforms and HR software vendors publish reports like this one as lead magnets and client briefs.
A report on your topic for a blog page, gated content or a lead magnet.
Written for your client and published under their brand, with my name left off.
Your report on marketintelligencetools.com, with 2 to 3 CTAs carrying your sponsored links.
Default terms: the report is yours to publish, and I keep the right to republish it on this site behind a gate, outside Google's index.
The federal surveys, platform reports and market houses behind each gig figure, and the count nobody runs every year
Government and multilateral sources: bls.gov (Contingent and Alternative Employment Arrangements, July 2023, released 8 November 2024), federalreserve.gov (Economic Well-Being of US Households in 2024, May 2025), census.gov (2023 Nonemployer Statistics, July 2025), openknowledge.worldbank.org (Working Without Borders, July 2023) and oii.ox.ac.uk (Online Labour Index).
Company and survey sources: upwork.com (Freelance Forward 2023 and Freelancing in America 2017), investors.upwork.com (third-quarter 2025 results), mbopartners.com (State of Independence 2026), adpresearch.com (ADP gig economy study, November 2025), newsroom.transunion.com (October 2024) and gigeconomydata.org (Gig Economy Data Hub).
Market sizes: businessresearchinsights.com (updated October 2026), marketresearch.com (DIResearch, LP Information and Global Info Research), market.us and gii.tw (QYResearch).
All figures checked 20 November 2026. BLS ran its contingent worker supplement in 2005, 2017 and 2023, on no fixed schedule, so no federal agency publishes a yearly count of gig workers.