Market analysis and competition: measuring who you're up against
 By Jan Suski. I go deep on every review, checking every number against its source and digging up details other coverage misses, a habit from six years of SEO and link building for tech companies. Bylines at Surfer, Brand24, and Senuto. How the scoring works.
The short version 12 points · 50 seconds
- 01Market sizing and competitor measurement share one inputSize the market, then measure the split
- 02Define the market before you name a single competitorUS agencies test it with a 5% price rise
- 03Direct, indirect and substitute competitors chase one budgetA direct-only list misses two of the three
- 04Competition is measurable with the HHIAbove 1,800 counts as highly concentrated
- 05The Census Bureau publishes concentration by NAICS code2022 Economic Census table, April 2025
- 06The market Google dominates scores at least 7,993A court found 89.2% of queries in 2020
- 07In a concentrated market, distribution decides the winnerDefault payments passed $26 billion in 2021
- 08The competitive landscape is step four of a market analysisSizing, dynamics and limiters come first
- 09Public rivals describe their competition in their 10-KsSEC Regulation S-K Item 101(c) lists it
- 10Primary research answers why a buyer switchedInterviews, surveys and focus groups
- 11A SWOT per competitor turns findings into a positionThe output is one stated competitive advantage
- 12Rerun the full analysis once a yearRefresh the data every couple of months
Market analysis and competition is the work of sizing a market and then measuring how the companies inside it split the customers, the sales and the profit. This guide is for founders, product marketers and analysts who need a competitive analysis that holds up in a budget meeting and supports real business decisions.
The first half of the work tells you how big the prize is. The second half, the competitive analysis, tells you how hard it'll be to take any of it, and that answer is a number. A market where one company handles 89% of queries, and its competitors split the rest, runs on different rules from one where 50 firms hold 2% each, and the competitive analysis you'd conduct in each looks different too.
This page treats competition as a property of the market you define, measured with the tools US antitrust agencies use: market definition, concentration ratios and the Herfindahl-Hirschman Index. One real market, the one Google dominates, runs through every step.
What market analysis covers, and where competition fits
Market analysis covers three aspects of a market: its size, the customers in it, and the environment around it, meaning regulation, input costs and the economy. Competitive analysis covers the companies already selling to those customers: their market share, product offerings, pricing, brand and marketing strategy.
Most guides treat these as two projects. They share one input, the market definition, and when that input is wrong both halves go wrong together. A company that sizes the whole cybersecurity industry and then benchmarks three email-security vendors has analyzed two different markets & drawn conclusions that fit neither. Catching that after the competitor grid is built sends the team back to the drawing board.
The wider program sits on other pages. Market intelligence analysis explains how competitor tracking sits next to customer and product data, and the fundamentals of market intelligence cover the three components of the discipline. This page stays on one question: how many competitors a defined market holds, how evenly they split it, and what that understanding tells a business to do with its strategy.
Define the market before naming competitors

The US Department of Justice and the FTC define a market by asking what customers would switch to if prices went up. Their 2023 Merger Guidelines run a hypothetical monopolist test, and on price the agencies say they "will often use a SSNIP of five percent", a small but significant and non-transitory increase in price.
Borrowing the test puts the team's understanding of the market boundary in writing. If a 5% price rise on your product or service would push enough buyers to another product, that other product sits inside your market and its maker belongs on your list of competitors.
Those guidelines also cite the Brown Shoe standard, which sets a product market's outer boundary by "reasonable interchangeability of use or the cross-elasticity of demand." A small business can conduct that test with ten customer interviews that ask what each buyer would purchase if the product disappeared tomorrow. The answers are qualitative data and insights that sit outside any sales report.
Draw the geographic area at the same time. The US Small Business Administration tells business owners to identify competition "by product line or service and market segment." A bakery's segment ends where customers stop driving, while a SaaS vendor's ends at the languages and currencies its product supports, which is why the same company can face different competitors in specific markets.
Industry codes are the quickest way to identify the first draft of the list. The Business Development Bank of Canada recommends looking up the North American Industry Classification System when competitors aren't obvious, since each business type carries a six-digit NAICS code.
The Census Bureau's NAICS lookup takes a keyword or a 2- to 6-digit code. The US, Canada & Mexico share the system, so one code pulls comparable industry data across all three markets.
Direct, indirect and substitute competitors
Direct competitors sell a product that does the same job for the same buyer in the same geographic area, the way two payroll apps for US restaurants do. They're the major competitors your sales team already names on calls, and buyers compare those competitors' products with yours feature by feature.
Indirect competitors meet the same customer needs a different way: a payroll bureau competes with payroll software, and a spreadsheet competes with both. Substitute competitors sell something else that wins the same budget. Bars, cafés, delis and supermarkets on one high street all compete for lunchtime consumer spending, each with a different menu and brand.
A list that stops at direct competitors is barking up the wrong tree. Lost-deal notes from a win-loss analysis are the fastest way to identify the other two kinds of competitors and the insights behind each loss: when buyers pick a contractor, an in-house build or no purchase at all, those options belong in the competitive analysis next to the rival logos.
Measuring how concentrated a market is
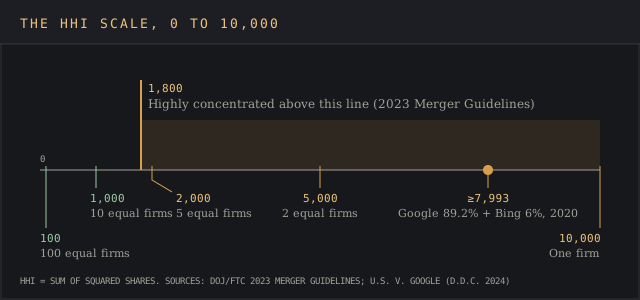
Once the market is drawn, the competitive landscape becomes arithmetic, and the analysis needs only market share figures to start. The four-firm concentration ratio, CR4, adds the market share of the four largest companies. The Herfindahl-Hirschman Index squares every firm's share and sums the squares, so one dominant company moves it far more than several mid-sized competitors.
The 2023 Merger Guidelines, issued on 18 December 2023, draw the line: "Markets with an HHI greater than 1,800 are highly concentrated." Their own footnote puts a market of five equal firms at 2,000, already over it.
In a highly concentrated market, a merger lifting HHI by more than 100 points is presumed to lessen competition. So is a merger that adds more than 100 points while creating a firm with over 30% share. For a business planning an acquisition, either threshold is a red flag worth pricing into the deal timeline.
The arithmetic is worth seeing on equal-sized firms, because it shows where the effort of a competitive analysis should go at each level of concentration and which competitors deserve a full profile.
| Market structure | Each firm's share | HHI | Against the 1,800 line | Where competitive analysis effort goes |
|---|---|---|---|---|
| One firm | 100% | 10,000 | 5.6 times over | Entry barriers, distribution, regulation |
| Two equal firms | 50% | 5,000 | 2.8 times over | Every pricing and product move of one rival |
| Five equal firms | 20% | 2,000 | Just over | Positioning between named competitors |
| Ten equal firms | 10% | 1,000 | Under | Segments and target markets each rival ignores |
| 100 equal firms | 1% | 100 | Far under | Customer acquisition cost and brand |
You rarely have to build the figure from scratch. The Census Bureau's 2022 Economic Census release schedule lists "Concentration of Largest Firms for the U.S.: 2022", published April 2025, which reports the revenue share of the largest firms and an HHI for selected sectors by NAICS code.
For a market that maps onto one code, that table is relevant data at zero cost. It lets a small business conduct the same concentration check a regulator would.
Worked example: US general search
The search engine market is the cleanest public example because a federal court measured it. In United States v. Google LLC, Judge Amit Mehta's memorandum opinion of 5 August 2024 found Google's share of general search queries had grown from 80% to 89.2% by 2020, and to 94.9% on mobile devices. Bing, in second place, receives roughly 6% of all queries.
Square those two shares and the HHI is at least 7,993 (89.2 squared is 7,957; 6 squared is 36), before counting any smaller engine. That's more than four times the 1,800 line. One company takes the lion's share and the rest of the market landscape is a fringe of competitors with single-digit shares.
Google's revenue-share payments to browser and phone makers for default placement totaled more than $26 billion in 2021, according to the same opinion. That's where the competitive advantage in this market sits.
A competitive analysis of this market that compared result quality and page speed, and skipped the default contracts, would have measured the wrong factors. The insights from the court record point toward an understanding of who controls access to the customer.
The higher the HHI, the more your analysis should study the gatekeepers between the leader and its customers: distribution contracts, suppliers and switching costs. Feature checklists earn their place at the fragmented end of the table, where similar products from many competitors fight over the same buyers and a small competitive edge in service or price decides the deal.
The five steps of a market analysis
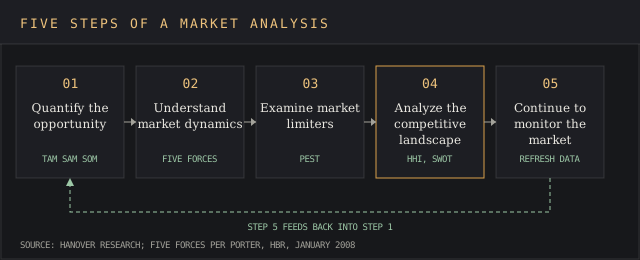
Hanover Research lays a market analysis out in five steps, and the order matters because each step narrows the next one:
- Quantify the opportunity: identify the total addressable market (TAM), the full demand for a product or service, the serviceable available market (SAM) you can target, and the serviceable obtainable market (SOM) you can realistically capture.
- Understand market dynamics: growth, consumer behavior, trends and the forces that set profit in the industry.
- Examine market limiters: the regulatory, legal and cultural barriers that add cost or block operations.
- Analyze the competitive landscape: market definition, concentration, and each rival's strengths and weaknesses, product offerings and success with customers.
- Continue to monitor the market, which turns a one-off report into a working habit.
The TAM template handles step one, and the market sizing calculator covers the top-down and bottom-up methods behind it. Skipping step one is how a business ends up with a detailed rival grid for a market too small to fund its growth strategy.
Step two has a standard frame for market dynamics. Michael Porter's Harvard Business Review article from January 2008 names rivalry among existing competitors, the power of suppliers, the power of customers, the threat of new entrants and the threat of substitutes.
Porter wrote that "the five forces reveal why industry profitability is what it is." HHI measures the first force. The other four explain why two markets with the same HHI earn different margins, and they fill most of a SWOT's threats column.
Step three is where a PEST analysis earns its place. Licensing rules, data-protection law and import duties all change who can do business in a market at all, so they shape the list of competitors before step four, the competitive analysis itself, starts.
Where competitor data comes from
Public companies hand you a large part of the competitive analysis for free, and the first place to identify a listed rival's own view of its competitors is its annual report. SEC Regulation S-K Item 101(c)(1)(ii) lists "trends in market demand and competitive conditions" among the topics a registrant describes, so the Business section of a rival's 10-K is straight from the horse's mouth.
Private competitors take more digging. Pricing for a private rival can be a needle in a haystack, and archived copies of its pricing page plus your own sales-call notes are the usual fix. The other public traces, and what each one shows:
- Press releases, product changelogs and trade-press articles: what a rival is building.
- Job postings: where it's hiring.
- Social media: its marketing tactics, brand voice and the emerging trends its audience reacts to; a month of a rival's social media posts is a fair sample of its brand positioning.
- Review sites: the pain points customers report with competitors' products and service.
Secondary market intelligence covers how to gather information from published sources like these without drowning in them. The sizing half leans on government statistics: the SBA's market research page lists a dozen free federal resources, among them Census Business Builder, the Bureau of Labor Statistics, the Consumer Price Index and the Bureau of Economic Analysis figures on consumer spending and GDP.
Secondary research, meaning existing reports and industry publications, answers what the market looks like and which trends are moving it. Primary research, meaning customer interviews, surveys and focus groups, answers why buyers pick one brand over other brands. It's how you analyze the reasons behind a switch.
The market research methods guide covers both; a competitive analysis needs at least one round of the second kind, because a buyer's reason for switching shows up in an interview and in no filing. Budget the resources to conduct it before the desk research starts.
Segment the interviews by target audience. A market segmentation split by demographics, location and need regularly shows one rival winning a segment and losing the next, and those splits are the valuable insights 20 calls can buy. Insights at that level of detail come from customers describing their own decisions, and they sharpen the understanding of each segment.
Turning findings into a competitive position
Findings become a strategy when each one answers where your company can win. Sort the insights into three piles first: findings about the market, findings about each rival, and findings about your own business.
A SWOT analysis per competitor puts strengths, weaknesses, opportunities and threats on one page, so the competitors' strengths sit next to your own weaknesses and the gaps are easy to identify.
Rank the competitors' strengths by how often customers mention them; the top three are the threats to plan against first. Opportunities and threats come from the market analysis, and the competitive analysis fills the other two columns. The SWOT template has the four-box grid ready.
Pricing strategy deserves its own pass. Map each competitor's pricing model and business model, per seat, per usage or flat, against what potential customers are willing to pay, measured by asking them. The devil's in the details here: a rival that looks cheaper per seat can charge separately for the integration your buyers need. Pricing intelligence covers how to keep that map current.
The output of the whole exercise, and the measure of its success, is one competitive advantage you can state in a sentence and back with a number from the analysis. It becomes the positioning in your marketing strategy, the focus of your sales strategy and go-to-market strategy, and the first line of a competitor battlecard for the sales team. A market intelligence strategy sets who owns each of those outputs once the study is done.
Strategy work in concentrated markets also points at new markets. When the HHI says the core market is locked, an adjacent segment with ten equal firms can be the better entry strategy for a company that wants to stay a step ahead, and the white space analysis template helps identify those openings.
How often to rerun the analysis
The BDC calls it good business practice to conduct a full competitive analysis at least once a year, with a quick data refresh every couple of months. Most firms already run some version: Hanover's State of Market Research found 71% of companies conduct market analysis research, and 78% of business leaders said using data to inform growth strategies increased revenue.
Between full runs, keep an eye on the events that move concentration and evaluate each one against your findings. A merger announcement, a funded new entrant or a court ruling all shift the HHI, and the guidelines' 100-point change is a usable alarm for your own market. A team that waits for the annual cycle after a rival's acquisition can miss the boat on the pricing response.
Online tools for market analysis cut the cost of keeping tabs on pricing pages, ad copy, social media and press releases, and they help analyze changes across dozens of competitors at once. Even free tools, a feed reader and a page-change monitor, cover most of the press-release side.
The competitive intelligence tools ranking compares the platforms that automate that monitoring. For the budget conversation, why market intelligence is important covers the case for funding the step at all.
FAQ
What is market analysis and competition?
It's the combined study of a market's size, customers and environment and of the companies competing for those customers. The competition half measures market share and concentration and evaluates each rival's strengths and weaknesses, which gives a business the understanding it needs to pick target markets, enter new markets and set a marketing strategy.
What are the 5 C's of marketing analysis?
Company, meaning the business itself, then customers, competitors, collaborators and context. The first three come from Kenichi Ohmae's 3C model, which the 3C analysis template lays out; collaborators and context add partners and the economic and regulatory climate.
What are the 5 steps of a competitive analysis?
Identify your competitors, gather information about them, evaluate their strengths and weaknesses, determine your competitive advantage, and monitor the market. The BDC lists the first four steps of a competitive analysis; the fifth keeps the findings current and the valuable insights from going stale.
What are the four P's of competitive analysis?
Product, price, place and promotion, compared rival by rival. The four P's work as the columns of the competitor grid in a competitive analysis, like the one in the competitive analysis template.
What HHI counts as a concentrated market?
The 2023 Merger Guidelines treat an HHI above 1,800 as highly concentrated. Five equal firms produce 2,000; ten equal firms produce 1,000.
How is market analysis different from market research?
Market research is the collection: surveys, interviews, purchased reports. Market analysis is what you do with the results, sizing the market, reading its dynamics and placing each competitor in it. Research supplies the data, and analysis turns it into the insights and understanding a company acts on across every aspect of its strategy.
Bottom line
Define the market with the question antitrust agencies ask, size it, then measure how concentrated it is before you build a single competitor grid. That order gives the team a shared understanding of which market it's competing in. Those three steps decide which competitors make the list and which questions the rest of the competitive analysis has to answer, from pricing to new markets.
The concentration number sets the agenda. At 7,993, as in the Google case, the analysis has to study distribution contracts and defaults, while a market near 1,000 rewards work on segments and features. A business that skips the measurement spends its research budget comparing features in a market where distribution contracts decide who wins, and builds its strategy on the wrong success factors.