Self-service business intelligence tools: 10 BI platforms ranked for 2026
 By Jan Suski. I go deep on every review, checking every number against its source and digging up details other coverage misses, a habit from six years of SEO and link building for tech companies. Bylines at Surfer, Brand24, and Senuto. How the scoring works.
· Prefer this source on Google
Quick comparison of self-service BI tools
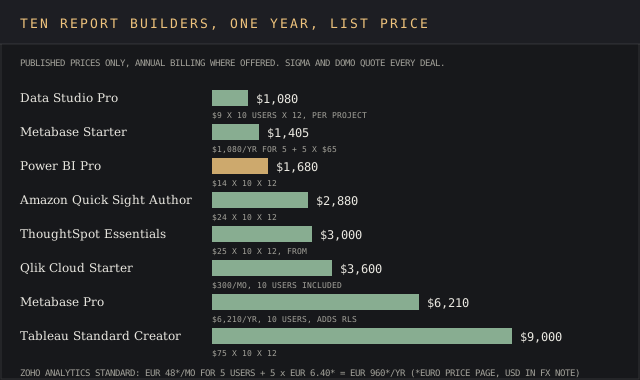
Ten self-service BI tools with row-level security on the cheapest paid plan, the cheapest seat that can build reports, and what ten builders cost for a year. The ten-builder column multiplies each published seat price by ten users for twelve billing periods. Quote-only BI solutions show Vendr's median.
| # | Tool | RLS on entry paid tier | Cheapest builder seat | 10 builders, one year | Best fit |
|---|---|---|---|---|---|
| 1 | Power BI | Yes, Pro | $14 Pro | $1,680 | Microsoft 365 shops |
| 2 | Qlik Cloud Analytics | Yes, section access | $300/mo for 10 users | $3,600 | ETL plus dashboards |
| 3 | ThoughtSpot | Yes, all plans | $25 Essentials | $3,000 | Non-technical teams |
| 4 | Amazon Quick Sight | Yes, Enterprise edition | $24 Author | $2,880 | AWS-hosted data |
| 5 | Tableau | Yes, data source or workbook | $75 Creator | $9,000 | Visual analysts |
| 6 | Sigma | Yes, user attributes | Quoted | $64,941 Vendr median* | Spreadsheet users |
| 7 | Metabase | Pro plan only | $100/mo for 5 users | $1,405 | SQL-literate small teams |
| 8 | Data Studio | Email filter only | $0, Pro $9 | $0 to $1,080 | Google marketing data |
| 9 | Zoho Analytics | Sharing filters | EUR 24*/mo for 2 users | EUR 960* | Zoho CRM customers |
| 10 | Domo | Quoted | Credits, quoted | $50,000 Vendr median* | Unlimited viewers |
Medians marked * are Vendr's anonymized buyer-reported contract values. Every other figure is the price the vendor publishes itself.
* Zoho Analytics shows US visitors its prices in euros, so they're quoted as published. At the European Central Bank reference rate of 1 EUR = 1.1403 USD, published 25 September 2026 and refreshed weekly, EUR 24 is about $27.37, EUR 960 is about $1,095, EUR 48 is about $54.73, EUR 115 is about $131, EUR 6.40 is about $7.30 and EUR 80 is about $91.22.
Where these figures come from
Seat prices are each vendor's own published list price, billed annually where the vendor offers it. The Vendr medians come from Vendr's marketplace headers, pulled on 25 September 2026. Neither Sigma nor Domo publishes a seat price, so those two rows carry Vendr's median.
ThoughtSpot also ranks #4 on our retail analytics software ranking, judged as search-led BI on a retail data model. Tableau shows up on the market research tools ranking as the visualization tool named in both Qualtrics' and SurveyMonkey's integration lists. This page judges all ten on row-level security, builder seat price and natural language on the plan a buyer would sign.
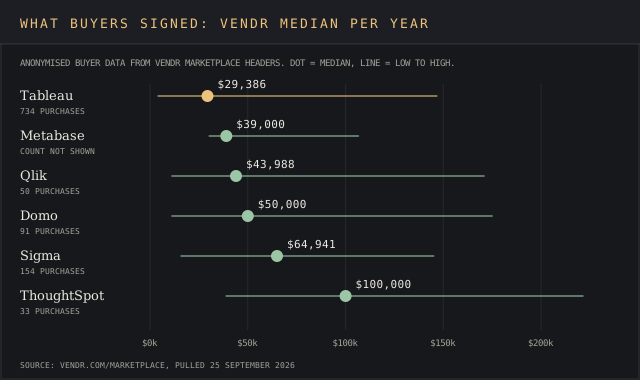
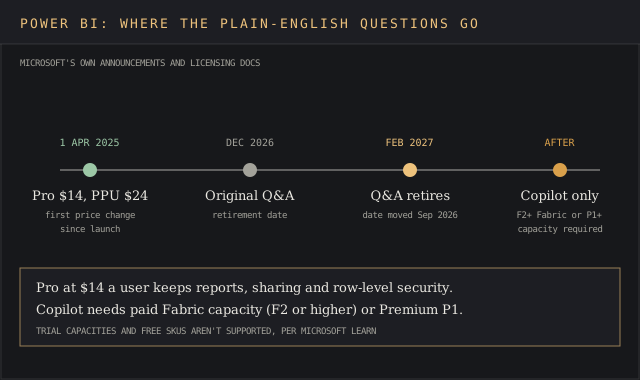
Self-service business intelligence tools let business users access data, create reports, create dashboards and explore data without filing a ticket with IT teams. Power BI Pro sells for $14 per user, billed yearly, after Microsoft's first price change since launch on 1 April 2025. ThoughtSpot's median buyer pays $100,000 a year, per Vendr's anonymised buyer data across 33 purchases.
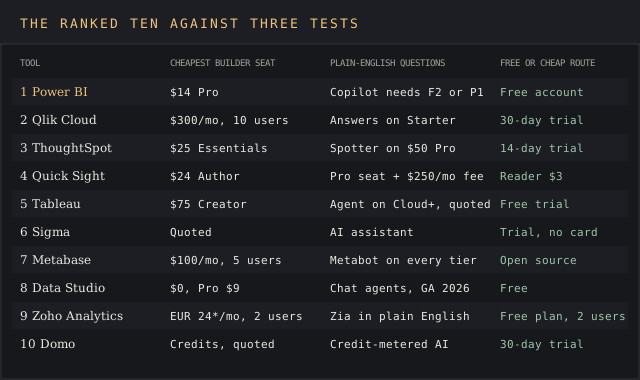
That spread is the elephant in the room for anyone buying self-service BI software. This page ranks ten self-service BI tools on five tests: row-level security on the cheapest paid tier, the published price of a seat that can build reports, natural language queries, the no-charge way in, and what real buyers signed.
It's written for data analysts, business leaders and data teams picking self-service BI software for data driven decisions across 10 to 500 BI users. Market sizing sits in our business intelligence market report, and the scoring rules follow our methodology.
Two dates make natural language the deciding test this year. Data Studio's chat went GA in July 2026 and Power BI's Q&A retires in February 2027, so the tier of each self-service BI platform that gets the chat interface now sets the real price.
Evaluation criteria for self-service BI tools
Five criteria decide the shortlist of self-service BI tools, and the ranking below weighs them in this order. Each "Why it's ranked" line names the test that settled the spot.
RLS on the entry paid tier
Open the security docs and note the lowest plan tier that includes RLS. Without RLS, data access is all or nothing, so every business user sees all the data in a dataset and data security depends on how carefully someone built each report.
Published price of a seat that can build reports
This test prices the cheapest license that can create reports and publish them, then multiplies it by ten users for a year. A vendor with no published number gets its Vendr median.
Natural language on the entry paid tier
Type a question in plain English and see if the plan you'd buy replies with a chart, then read between the lines of the plan page. Many self-service BI tools gate natural language queries behind a higher tier, a capacity purchase or a flat fee, and that gate is a line item.
Free plan or trial length
Count the days before a card gets charged, because a one-month trial leaves business teams time to connect real data sources and test data integration beyond a demo.
What buyers signed, per Vendr
Vendr publishes a median contract, purchase count and range for many BI solutions, which settles ties between quote-only self-service BI tools.
The 10 best self-service BI tools, ranked
Microsoft Power BI
Best fit
Organizations already on Microsoft 365 that want governed self-service BI at the lowest published price per builder.
Power BI Pro sells for $14 per user, billed yearly. Pro caps a semantic model at 1 GB with 8 automated data refreshes a day. Premium Per User lifts that to 100 GB and 48 refreshes for $24. Desktop authoring costs nothing, so data analysts can hit the ground running on data modeling before anyone buys a seat.
Copilot requires "Paid Fabric capacity (F2 or higher) or Power BI Premium (P1 or higher)", and the older Q&A feature retires in February 2027. After that, questions in plain English mean a capacity purchase on top of Pro.
Key features
- Semantic models with DAX metrics, shared across reports and dashboards as governed data models.
- RLS roles defined in the model and applied to Viewer permissions.
- Power Query for data transformation and data integration from data sources such as Excel spreadsheets, SQL databases and cloud lakehouses.
- Copilot to create visualizations, create reports from a prompt and reply to questions on F2 or higher capacity.
- An Embedded tier for embedded analytics with no per-user viewer license.
Pricing
Fabric capacity reservations save 40.5% against pay-as-you-go, per Microsoft's pricing page. Ten builders on Pro run $1,680 a year.
Pros
- Lowest published price for a governed self-service builder seat.
- Desktop authoring at $0 makes the trial endless.
- RLS works on Pro with no add-on.
Cons
- DAX data modeling has a steep learning curve for less technical users.
- RLS skips workspace Admin, Member and Contributor roles, so one careless invite exposes every row.
- Copilot needs capacity a Pro-only shop doesn't own, a bitter pill to swallow after February 2027.
A G2 reviewer who is "learning AI Automation and Agentic AI" wrote in February 2026 that "DAX is still brutal for beginners, it's powerful but way too easy to mess up and hard to debug" (G2).
Why it's ranked #1. It passes the RLS test on a $14 self-service BI seat, so ten builders cost $1,680 a year, $1,920 less than Qlik's $3,600 Starter plan for the same ten users.
Qlik Cloud Analytics
Best fit
Teams of about ten that want data pipelines, interactive dashboards and a question box in one self-service analytics platform.
Starter is $300 a month billed annually for 10 users and a fixed 10 GB, with "Access to Answers Agents" and an MCP server. Standard at $825 drops the per-user charge and starts at 25 GB. Premium runs $2,750.
The associative engine behind Qlik Sense lets business users click through selections across every table in an app, which makes it good for data exploration and ad hoc analysis on complex data. Section access handles row reduction inside the load script, which rewards admins who know the ropes.
Key features
- Qlik Answers agents on Starter for questions typed in English.
- Load-script ETL for data transformation, so automated data pipelines and dashboards live in one app.
- Section access to reduce rows by user.
- Standard connectors for "100s of data sources".
- Per-user charges drop to zero from the $825 Standard plan upward.
Pricing
The top tier is quoted. A 30-day trial needs no card. Vendr's anonymised buyer data puts the median at $43,988 across 50 purchases, from $10,944 to $171,127.
Pros
- Self-service questions on the entry tier, with no capacity purchase.
- One-month trial, the longest among the published-price tools.
- Standard's flat pricing holds steady as the company grows past ten users.
Cons
- Starter's 10 GB is fixed and can't be topped up.
- Script functions and data modeling carry a steep learning curve, per reviewers.
- Per-builder price is double Power BI's at ten users.
An associate vice president at an enterprise firm credited "its ability to handle ETL while also serving as a strong dashboarding tool" in March 2026, and wrote that "It’s a bit less user-friendly compared to Tableau and Power BI" (G2).
Why it's ranked #2. Agents on the $300 Starter plan beat ThoughtSpot, which keeps them for its $50 Pro seat, and its trial runs 30 days to ThoughtSpot's 14. It trails Power BI's $1,680 ten-builder bill by $1,920.
ThoughtSpot
Best fit
Non-technical teams that should type a question into a search bar and get charts back.
ThoughtSpot built its self-service analytics platform around search. Essentials starts at $25 per user for 5 to 50 users and 25 million rows. Pro starts at $50, covers up to 1,000 users and 250 million rows, and adds natural language search plus Spotter agents at 25 queries per user.
It bought Mode Analytics for $200 million in cash and equity, closing on 19 July 2023. Mode's tooling now runs as Analyst Studio on the top plan, with a notebook in Python or R for advanced analysts and data scientists.
Key features
- Search-driven data exploration on live cloud data platforms.
- Spotter AI agents, unlimited on the top plan, with 1-hour support.
- RLS, SSO and encryption across plans.
- Analyst Studio for data analytics in SQL, Python or R.
- Unmetered LLM tokens on every plan.
Pricing
The top plan is quoted. The trial runs two weeks with no card. Vendr's buyer data shows a $100,000 median across 33 purchases, from $38,640 to $221,653, so it can cost an arm and a leg next to Power BI.
Pros
- The search bar makes sense for business users who never learned SQL.
- Published per-user price of $25 on the entry tier.
- LLM tokens are unmetered.
Cons
- Search in plain English needs Pro at $50.
- Essentials stops at 50 users and 25 million rows.
- Highest Vendr median of any ranked tool.
An associate data engineer wrote in January 2026 that "The formulas don’t use SQL or Excel-style formatting" (G2). A small-business data analyst added that month: "You don’t need to be a BI developer to manage the system" (G2).
Why it's ranked #3. Spotter on the $50 Pro seat puts ten question-askers at $6,000 a year, under Quick Sight's $7,800. It loses to Qlik, whose $300 Starter includes agents for ten.
Amazon Quick Sight
Best fit
Companies whose business data already lives in AWS and whose BI users mostly open dashboards.
AWS sells Quick Sight as the self-service BI piece of Amazon Quick. The pricing page shows Author at $24 per user, Reader at $3, Author Pro at $40 and Reader Pro at $20. A $250 infrastructure fee applies to any setup with a Pro user or Q&A switched on.
The devil's in the details on Q&A, since it needs Author Pro seats and switches that fee on. RLS is an Enterprise edition feature, and the $24 Author rate is that edition's price.
A year of ten Author Pro seats with Q&A: $4,800 in seats plus $3,000 in fees. Ten Author seats come to $2,880 a year.
Key features
- $3 Reader seats for large read-only audiences.
- Dataset rules for row filtering by user.
- Q&A topics for data analysis in plain English on Pro seats.
- Author Pro at $40 with generative AI features.
Pricing
Per seat as above, plus the $250 fee once Pro or Q&A is on. A $9 Standard edition exists through the API.
Pros
- Readers analyze data in dashboards for $3.
- RLS on the $24 Author seat.
- AWS-hosted data needs no separate servers.
Cons
- Q&A makes a $250 fee plus Pro seats mandatory.
- The $9 Standard edition lacks RLS.
- Visual design looks dated to at least one reviewer.
A telecom marketing program manager wrote on TrustRadius in May 2025 that "Sometime it Lags when working with Large Database" and "Visualization is a bit outdated" (TrustRadius).
Why it's ranked #4. A $24 governed Author seat beats Tableau's $75 Creator by $51. It trails ThoughtSpot because natural language queries run $7,800 a year for ten users, $1,800 more than ThoughtSpot's $6,000.
Tableau
Best fit
Analysts who build data visualization all day and organizations standardised on Salesforce.
Salesforce completed its acquisition of Tableau on 1 August 2019. Tableau Cloud Standard charges $75 per Creator, $42 per Explorer and $15 per Viewer, billed annually. The next edition up raises those to $115, $70 and $35. Tableau makes every deployment include at least one Creator license.
Tableau Agent comes with the quoted Cloud+ edition, and Tableau Next adds its Semantics layer at $40 per user.
Key features
- A drag and drop interface for data visualization, with Prep Builder for Creators.
- Pulse summaries of key metrics on Standard.
- RLS at the data source or workbook, with data policies needing Data Management.
- Semantics and native Slack integration in the Next product.
Pricing
Vendr's buyer data shows a $29,386 median across 734 purchases, from $3,904 to $146,916, with 13% average savings.
Pros
- Lowest Vendr median among the six tracked tools.
- Vendr's sample of 734 purchases is the largest here.
- 4,223 G2 ratings averaging 4.4.
Cons
- $75 Creator seat is the priciest published builder license here.
- Agent buyers bite the bullet on a quoted Cloud+ contract.
- Level-of-detail expressions and data modeling take real study.
A small-business reviewer wrote in September 2026 that "The cost is steep, especially once you scale up licenses across a team" and that "complex calculations or LOD expressions have a real learning curve" (G2).
Why it's ranked #5. Its $75 Creator seat is three times Quick Sight's $24 Author, and its chat features sit behind a quote. It beats Sigma by publishing a price, and its Vendr median is $35,555 lower.
Sigma
Best fit
Finance and ops teams who think in spreadsheets, want to be self sufficient, and already run a cloud data warehouse.
Sigma puts a spreadsheet interface on top of the data warehouse, and input tables write back to it. It reported $200 million in ARR in April 2026 and raised $80 million at a $3 billion valuation with more than 2,000 customers.
Key features
- Spreadsheet formulas to analyze data on live warehouse tables.
- Input tables for manual data entry and what-if scenarios.
- RLS through user attributes and CurrentUserAttributeText().
- An AI assistant that fields ad hoc requests.
Pricing
Quote-only pricing is par for the course at this end of the market. Vendr's anonymised buyer data shows a $64,941 median across 154 purchases, from $15,585 to $145,339, with 25% average savings. The trial needs no card.
Pros
- Spreadsheet layout suits Excel users.
- Write-back makes reports into planning apps.
- Buyers report 25% average savings on Vendr, the deepest here.
Cons
- Every deal is quoted, and Vendr's median is $64,941.
- Needs a cloud warehouse and data pipelines behind it.
- Large workbooks with complex data slow down, per reviewers.
"It acts as an accurate, self-serve solver for non-technical users, freeing up our analytics team from fielding repetitive one-off questions."
Principal of data analytics at a large firm, September 2026 (G2).
A mid-market analyst added in April 2026 that it "Gets a bit laggy when workbooks have a lot going on lots of elements, big datasets, that kind of thing" (G2).
Why it's ranked #6. RLS through user attributes comes with every Sigma deployment, and Metabase keeps row permissions for its $575 Pro plan. It trails Tableau because Sigma quotes every deal and its $64,941 Vendr median sits $35,555 above Tableau's $29,386.
Metabase
Best fit
Small companies doing data analytics with one person who writes SQL and a tight budget.
Metabase is an open source self-service analytics platform, claims 100,000+ companies and shows 49.4k GitHub stars on its homepage. Docker makes the self-hosted install a single command. The cloud Starter plan is $100 for 5 users plus $6 per extra user. Pro is $575 for 10 users and adds "Row and column level permissions".
Key features
- A user friendly visual query builder next to a SQL editor, for data analysis by non-technical users.
- Metabot for questions in English on every tier, open source included.
- Row and column permissions on Pro and above.
- 40+ database connectors, Snowflake, BigQuery and PostgreSQL among them.
Pricing
Billed yearly, Starter is $1,080 plus $65 per added user, Pro is $6,210 and the top plan begins at $20,000. Cloud plans carry a two-week trial, and small teams can begin on Starter and cross that bridge when they come to it on RLS. Vendr's buyer data shows a $39,000 median, from $30,000 to $106,800.
Pros
- Self-hosted at no charge for anyone with a server.
- Natural language on every tier.
- Ten Starter builders come to $1,405 a year.
Cons
- RLS needs Pro at $6,210 a year.
- Speed depends on the database under it.
- Business users without SQL hit a ceiling.
An order opener at a mid-market company wrote in April 2026: "I'm not well versed in SQL, so I would like alternative coding systems" (G2).
Why it's ranked #7. Row and column permissions on Pro beat Data Studio's email filter. It trails Sigma because Metabase's row permissions need the $6,210-a-year Pro plan and Sigma includes RLS in every deployment.
Data Studio (formerly Looker Studio)
Best fit
Marketers reporting on business data from Google Ads, GA4, BigQuery and Google Sheets at no license charge.
Google renamed Looker Studio to Data Studio on 16 April 2026, and opened Conversational Analytics to all users the same day. That feature reached general availability on 30 July 2026. The product page cites 1,400+ data sources, and community connectors make up the lion's share at 1,300+.
Row control runs through an email filter that shows each viewer only rows matching their address.
The email filter needs an exact case match, so "Bob@example.com" won't match "bob@example.com".
Key features
- Native connectors to Google Ads, GA4, BigQuery and Google Sheets.
- Conversational Analytics with BigQuery data agents.
- Drag and drop data blending to visualize data from several sources in one chart.
- Email filtering to personalise rows per viewer.
Pricing
Creators and viewers pay nothing. Pro costs $9 per user per project and adds team workspaces and admin controls, and ten Pro users on one project come to $1,080 a year.
Pros
- A $0 license makes it good for self-service analytics on Google data.
- 1,400+ connectors on the product page.
- Conversational questions at no charge since the 2026 update.
Cons
- Email filtering stands in for RLS.
- Semantic modeling needs LookML, the Looker modeling language, which ships with the separate paid Looker product.
- 1,300+ of the 1,400+ connectors are community-built.
A Hacker News user recommended it in February 2023 for teams already in Google's suite: "Since you're already using Google sheet, fastest nocode dashboard available should be Google Data Studio" (Hacker News).
Why it's ranked #8. A $0 license and no-charge Conversational Analytics beat Zoho's EUR 24* entry plan on price and natural language. Metabase ranks above it on the first criterion, since its $6,210 Pro plan carries row and column permissions and Data Studio's only row control is an email filter.
Zoho Analytics
Best fit
Business users at small firms already on Zoho's CRM or Zoho Books, who kill two birds with one stone through native sync.
Zoho Analytics connects to 500+ live data sources and reports 3 million users. Its Zia assistant takes questions in English and makes charts from them. The euro pricing page shows Basic at EUR 24* billed annually for 2 users and 0.5 million rows, Standard at EUR 48* for 5 users, and Premium at EUR 115* for 15.
Key features
- Zia for AI powered insights and data insights in chat.
- 500+ connectors with native sync to Zoho's sales apps.
- Free plan: 2 users, 10,000 rows, 5 workspaces.
- Cloud and on-premise editions.
Pricing
Extra users cost EUR 6.40* each. Ten users on Standard come to EUR 960* a year. Paid plans start with a 15-day trial.
Pros
- Permanent free plan for 2 users.
- Row limits rise with each paid tier.
- Deep Zoho CRM integration.
Cons
- Row caps start at 0.5 million on Basic.
- Viewers run EUR 80* per 25.
- Basic stops at 2 users.
A financial services IT manager wrote on TrustRadius in April 2025 that it's "Easy to use and filter if the source of data is set up correctly" (TrustRadius).
Why it's ranked #9. A permanent free plan and a published EUR 24* entry price beat Domo's quote-only credits. It trails Data Studio, which charges $0 and ships chat at no charge.
Domo
Best fit
Mid-size firms that want unlimited viewers for self-service data analytics and prefer paying for compute.
Domo prices its self-service analytics platform in credits. Storing data, updating tables, running workflows and ML inference all draw them down, and business users are unlimited. It shows 1,000+ pre-built connectors. Revenue for fiscal 2026 was $318.9 million, up 1%, a red flag for anyone committing to a multi-year deal.
Key features
- 1,000+ pre-built connectors to data sources.
- Credits cover data management, from storage and table updates to data pipelines and workflows.
- Unlimited users on every contract.
- 30-day trial with onboarding support and one training session.
Pricing
Quoted and credit-based. Vendr's anonymised buyer data shows a $50,000 median across 91 purchases, from $10,920 to $175,245, with 13% average savings.
Pros
- Viewer count never raises the bill.
- 1,000+ connectors, second only to Data Studio here.
- Full-platform trial.
Cons
- Pricing is quote-only, with a $50,000 Vendr median.
- Credit metering makes spending hard to forecast before a pilot.
- Revenue growth of 1% in fiscal 2026.
A verified IT administrator at a small software company wrote on TrustRadius in June 2024: "for us we don't need so many users. so the way Domo is licensed, realising ROI is difficult to justify" (TrustRadius).
Why it's ranked #10. Domo carries a one-month trial and 1,000+ connectors for data collection. It ranks last because every contract is quoted in credits, and Vendr's $50,000 median sits far above Zoho's EUR 960* list price for ten users.
What self-service business intelligence means
Self-service business intelligence gives business users direct data access for decision making, so a sales manager can build her own reports without relying solely on a BI developer and make data driven decisions that week. IBM's definition is plain: "Business users can create reports, perform ad hoc analyses, take appropriate actions and make independent decisions."
In traditional BI, Domo's glossary says IT teams "control access, generate reports, and often act as gatekeepers to critical insights", and the work "Requires Structured Query Language (SQL), coding, or specialized training." Every request joins a queue, and the reply arrives after the meeting it was for.
The idea is at least 16 years old.
A 2018 CIO.com history by Cristina Lago reports that "By 2010, 35% of enterprises use pervasive BI and 67% of 'best in class' companies have some self-service BI."
Since 2010 the price of self-service BI tools, the AI layer and the cloud data platforms underneath have all changed, and a governed Power BI Pro seat now costs $14. For how BI differs from outward-looking research, see market intelligence vs business intelligence.
The two models split the work across four jobs.
| Job | Traditional BI | Self-service BI |
|---|---|---|
| Who builds reports | IT departments or a BI consultant | Business users |
| Skills required | Writing SQL and data modeling | A drag and drop interface and governed data models in self-service analytics |
| Where the bottleneck sits | The report queue | Data quality and metric definitions in self-service BI tools |
| Who owns governance | IT teams | IT teams |
IT teams own governance in both models, so buyers of BI solutions should budget IT time when they make data driven decisions about tooling.
Benefits of self-service BI, and the claims behind them
The benefits of self-service BI get quoted with big numbers, so check each source.
Domo's glossary states that "Organizations that implement self-service BI with proper governance often see 50 to 80 percent reductions in routine reporting time." It cites no study, so read it as a vendor's claim.
Gartner's March 2024 note by Georgia O'Callaghan is more careful: self-service analytics is deployed "to democratize data and relieve some of the burden placed on central data and analytics (D&A) teams". The Power BI adoption roadmap describes the failure state straight from the horse's mouth: "The enterprise data team can't keep up with the needs of the business. A significant backlog of requests exists for this team."
Five benefits hold up when you test them:
- Faster ad hoc analysis. A business user who can explore data gets relevant information without a ticket, and data teams stop fielding one-off pulls. A mid-market data engineer on G2 reports spinning up "live dashboards in minutes" in Power BI.
- Cost efficiency. Microsoft's Purview docs list "Cost-effective" as a benefit of self-serve analytics, because data already sits in OneLake and teams reuse the tools they own.
- Data literacy and a data driven culture. Microsoft defines data literacy as "the ability to interpret, create, and communicate with data and analytics accurately and effectively." Business users build it by making data driven decisions every week.
- Collaboration. Business teams share dashboards over email, Slack, Microsoft Teams and Google Sheets, per Itransition's feature checklist.
- Informed decisions on changing conditions. IBM says that with good data available, business leaders and employees can "respond quickly to changing circumstances."
Real time data sits on that same list. Capgemini's Dan Simion put the buyer's test to TechTarget as a question: "Do the tools accommodate real-time or near-real-time data or not?" The Power BI Pro license's limit of 8 refreshes per 24 hours is one reply. Our guide to real-time market intelligence covers where live feeds pay off.
Features that separate self-service BI platforms
Every seller of self-service BI tools claims the same checklist, so test each item with a number or a named product. Eight self-service capabilities separate the platforms:
- An intuitive drag and drop interface for data visualization. IBM describes "Drag-and-drop interfaces and automated data visualization" that fill dashboards with data relevant to each role, so users can build dashboards without code.
- Augmented analytics. IBM again: "Augmented analytics turns complex data sets into digestible, actionable insights." In self-service BI tools that's Copilot, Qlik Answers, Spotter, Metabot and Zia, plus predictive analytics on some plans.
- Natural language queries. TechTarget's Lisa Morgan wrote in July 2022 that users can ask questions "without knowing a query language like SQL."
- Connectors to data sources. Counts run from 40+ databases in Metabase to 1,400+ sources in Data Studio.
- A governed semantic layer. Fabric semantic models, Tableau Semantics, LookML and ThoughtSpot's models store shared metric definitions once.
- Custom reports and interactive dashboards with drill down, filtering and visualization options for all the charts on a page.
- Row-level security and permissions to maintain data security as more people across different departments get access.
- Embedding for embedded analytics inside apps, such as Power BI's Embedded tier. Our ranking of market intelligence APIs covers the data feeds that sit under them.
Risks of self-service analytics for data quality, security and silos
Self-service analytics fails in four predictable ways. Itransition's checklist names three of them, and Cube's 2026 comparison names the fourth. Poor data quality shows up as "Data silos, inconsistency, duplication, and incompleteness." Security risk grows because more users and more access mean "More loopholes for stealing and misusing data." User resistance comes from employees who feel "insecure because of their insufficient skills."
The fourth is metric drift. Cube's 2026 comparison of self-service analytics tools puts it bluntly: open data up and "you get fifteen definitions of 'active user.'" Metric drift sends conflicting reports to the board, with one metric forked across finance, product and the exec deck, and it builds data silos between departments.
Gartner's note flags the usual cause, an executive mandate that pushes teams to "launch first, govern later", with data governance bolted on after the damage. For catalog and lineage, see our ranking of data intelligence tools.
A strong semantic layer is the middle ground between lockdown and chaos, and it keeps finance and product on the same page, because data teams own trusted metrics, handle data management, and business users build on top of them.
How to implement self-service BI in six steps
Itransition's best practices to implement self-service BI reduce to six steps that apply to all self-service BI tools here, and each has a written test:
- Audit data sources. Map every database and app, and mark which data points and relevant data feed the first dashboards.
- Set benchmarks. Record the report backlog and average time from question to answer, so success has a number.
- Involve stakeholders. Name finance leads, ops managers, data analysts and IT teams, each with stated business requirements.
- Build governance first. Data teams set up certified datasets, a governed semantic layer and RLS before the first business user logs on.
- Train continuously. One-off training fades and data literacy with it, so the organization needs ongoing support. Schedule sessions each quarter and track which business users build their own reports.
- Close the feedback loop. Track self-service adoption by dashboard and retire the dashboards nobody opens, since a self-service BI implementation that nobody uses sends the team back to the drawing board.
After launch, analysts become owners of data analytics models and business processes. Our profile of the market intelligence analyst covers the skills that transfer.
Pricing across self-service BI software
Published prices tell half the story of a self-service BI implementation. Ten builders run from $1,080 on Data Studio Pro to $9,000 on Tableau Creator, and the hidden charges on self-service analytics tools are the $250 Quick Sight fee, Fabric capacity for Copilot, Metabase's RLS upgrade and Domo's credits.
Average savings Sigma buyers report on Vendr, so a first quote from BI solutions sellers is an opening bid.
Free self-service BI tools and their limits
Good self-service tools at no charge exist among the ranked BI solutions, and each stops at a clear line:
- Google Data Studio. Free for creators and viewers, with an email filter standing in for RLS.
- Power BI Desktop. Builds reports at no charge, and publishing to the Power BI service needs a work or school email, so a Gmail address can't sign up directly.
- Metabase open source. Free to self-host, with row and column permissions on paid Pro.
- Zoho Analytics. Free for 2 users and 10,000 rows.
Excel sits one step below, and all self-service BI tools on this page import Excel files for data analytics. Teams that outgrow dashboards and want pattern mining, predictive analytics or forecasts on raw tables can move to the tools in our data mining tools ranking and our demand forecasting software ranking.
Self-service BI FAQ
What are the best self-service business intelligence tools?
Power BI, Qlik Cloud Analytics and ThoughtSpot lead this ranking of self-service BI tools, on a $14 governed seat, agents on a $300 plan for 10 users, and search for non-technical users.
Can Power BI be self-hosted?
Yes, through Power BI Report Server, "an on-premises report server with a web portal." It comes with Fabric F64+ reserved instances, Premium P SKUs or SQL Server core licenses, and publishing still needs a Pro license.
Is Excel considered a BI tool?
Excel is a spreadsheet many teams use for BI tasks, and every self-service BI platform above imports it as a source for dashboards.
What are the best AI tools for business intelligence?
Among self-service analytics tools, check which tier gets the AI. Qlik's agents ship on the $300 Starter plan, Metabot runs on open source, Data Studio's chat comes at no charge, and Power BI's Copilot needs F2 capacity. For AI that supports decision making with recommended actions, see our ranking of decision intelligence platforms.
Bottom line
For most organizations, Power BI is the default self-service BI tool at $14 for a governed builder seat. Budget for Fabric capacity before promising anyone Copilot.
Among the other self-service BI tools, pick Qlik Cloud Analytics for agents on a $300 entry plan, and ThoughtSpot if your business users will search before they drag. Amazon Quick Sight fits AWS shops at $24 an Author seat, and Tableau fits analysts who live in data visualization and can pay $75 per Creator.
Sigma suits spreadsheet-minded finance teams, Metabase suits SQL-literate small teams, Data Studio suits marketers on Google data, and Zoho Analytics suits Zoho CRM customers. Domo fits if unlimited viewers outweigh a $50,000 median contract.