Mortgage rates history: 18.63% in 1981, 2.65% in 2021 and 7.11% in November 2026
 By Jan Suski. I go deep on every review, checking every number against its source and digging up details other coverage misses, a habit from six years of SEO and link building for tech companies. Bylines at Brand24 and Senuto. How the scoring works.
The numbers U.S. 30-year fixed mortgage rates, checked 17 November 2026
Today's 7.11% sits 0.53 points under the 50-year average of 7.64%, so the rate looks high only against the 2010s, when no annual average topped 4.69%.
The 10-year Treasury yield rose 1.08 points between 26 February and 12 November 2026, against a 1.13-point rise in the mortgage rate, so the bond market explains most of this year's climb.
Lenders still wrote $595 billion of new mortgages in the third quarter, when the monthly average rate ran between 6.54% and 6.86%.
Lenders, brokers and proptech firms quote rate history in every pitch. Send the country or the loan type and I'll source a version you own.
Freddie Mac's average 30-year fixed mortgage rate stood at 7.11% on 12 November 2026, up from 6.24% a year earlier, according to the Primary Mortgage Market Survey. The series began in April 1971. Its weekly high was 18.63% on 9 October 1981 and its low was 2.65% on 7 January 2021, a gap worth $4,622 a month on a $400,000 loan.
This report lays out mortgage rates history by year, by month since January 2021 and week by week through 2026, with the record highs and lows, the reasons published series disagree and what each rate level costs a borrower. The focus is the 30-year fixed rate, the one series with weekly historical data back to 1971. Every annual figure averages Freddie Mac's weekly readings as aggregated by the Federal Reserve Bank of St. Louis (FRED series MORTGAGE30US).
It's written for borrowers deciding when to lock a loan, analysts who need a citable series and lenders who check a headline figure with the data behind it. Rates climbed 1.42 points from February's 5.98% low to 7.40% in October, and the Fed raised its target once.
Mortgage rates history by year, 1971 to 2026
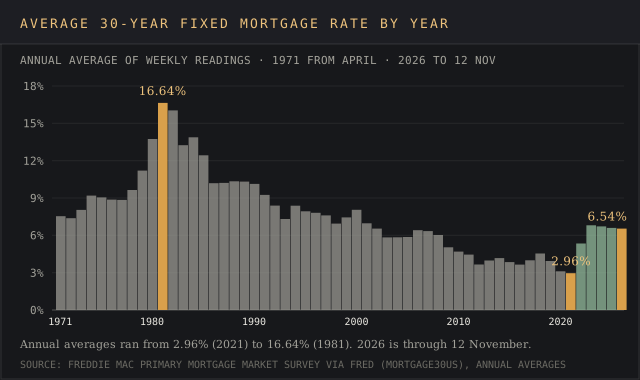
The table lists the average 30-year fixed rate for every year since the primary mortgage market survey began. Each figure averages that year's weekly readings. 1971 starts in April, and 2026 runs through 12 November.
Three stretches dominated the series. The 1980s averaged 12.70% across the decade. The 2010s averaged 4.09%. And 2022 added 2.38 points in a single year, the biggest one-year rise since 1981's jump of 2.90 points.
Copy these lines into an email, fill them in and send. I reply with scope and a price within 2 to 3 business days.
Open the email| Year | 30-year fixed rate, annual average |
|---|---|
| 1971 (from April) | 7.54% |
| 1972 | 7.38% |
| 1973 | 8.04% |
| 1974 | 9.19% |
| 1975 | 9.05% |
| 1976 | 8.87% |
| 1977 | 8.85% |
| 1978 | 9.64% |
| 1979 | 11.20% |
| 1980 | 13.74% |
| 1981 | 16.64% |
| 1982 | 16.04% |
| 1983 | 13.24% |
| 1984 | 13.88% |
| 1985 | 12.43% |
| 1986 | 10.19% |
| 1987 | 10.21% |
| 1988 | 10.34% |
| 1989 | 10.32% |
| 1990 | 10.13% |
| 1991 | 9.25% |
| 1992 | 8.39% |
| 1993 | 7.31% |
| 1994 | 8.38% |
| 1995 | 7.93% |
| 1996 | 7.81% |
| 1997 | 7.60% |
| 1998 | 6.94% |
| 1999 | 7.44% |
| 2000 | 8.05% |
| 2001 | 6.97% |
| 2002 | 6.54% |
| 2003 | 5.83% |
| 2004 | 5.84% |
| 2005 | 5.87% |
| 2006 | 6.41% |
| 2007 | 6.34% |
| 2008 | 6.03% |
| 2009 | 5.04% |
| 2010 | 4.69% |
| 2011 | 4.45% |
| 2012 | 3.66% |
| 2013 | 3.98% |
| 2014 | 4.17% |
| 2015 | 3.85% |
| 2016 | 3.65% |
| 2017 | 3.99% |
| 2018 | 4.54% |
| 2019 | 3.94% |
| 2020 | 3.11% |
| 2021 | 2.96% |
| 2022 | 5.34% |
| 2023 | 6.81% |
| 2024 | 6.72% |
| 2025 | 6.60% |
| 2026 (to 12 November) | 6.54% |
Average 30 year fixed rate by decade
Decade averages smooth out the weekly noise. Rates below 5% held for one decade out of six, the 2010s, and every other decade ran higher. The rest of the record, from 1971 to 2009, never produced an annual average lower than 5.04%.
| Decade | Average | Lowest year | Highest year |
|---|---|---|---|
| 1970s (1971 to 1979) | 8.86% | 7.38% (1972) | 11.20% (1979) |
| 1980s | 12.70% | 10.19% (1986) | 16.64% (1981) |
| 1990s | 8.12% | 6.94% (1998) | 10.13% (1990) |
| 2000s | 6.29% | 5.04% (2009) | 8.05% (2000) |
| 2010s | 4.09% | 3.65% (2016) | 4.69% (2010) |
| 2020s (2020 to 2025) | 5.26% | 2.96% (2021) | 6.81% (2023) |
Across the 50 years from 1976 to 2025, the annual average landed between 6% and 9% in 19 years, above 9% in 14 and below 6% in 17. The median year came in at 6.96%. A buyer who compares today's rates with the past decade sees a rate that costs an arm and a leg. Compared with the rest of the half-century, based on the same data, it's an ordinary year, and lower than the 1976 to 2025 average.
Highest and lowest mortgage rates on record
The record high came during the Federal Reserve's fight against inflation. Consumer prices rose 13.5% in 1980 and 10.4% in 1981, by our calculation from the BLS consumer price index on FRED, and the effective federal funds rate averaged 16.38% in 1981.
- The 30-year rate first crossed 18% in the week of 11 September 1981, at 18.22%.
- It peaked at 18.63% on 9 October 1981.
- Rates stayed above 18% through 13 November 1981, ten straight weekly readings.
- October 1981's five weekly readings average 18.45%, the source of the rounded 18.4% figure many sites quote.
Policy ran the other way at the record low. The Fed cut the top of its target range from 1.75% to 0.25% in March 2020 and held it there until March 2022, per FRED's DFEDTARU series. The 30-year rate reached 2.65% on 7 January 2021, and the monthly average stayed under 3% for most of 2021, last in September at 2.90%. Low rates lasted about as long as the policy did, and rates fell further than at any point since the beginning of the series.
In the past ten years, the highest weekly reading came on 26 October 2023, at 7.79%, and Freddie Mac's 2023 peak didn't break 8%. Bankrate's history report says the 30-year rate "broke through 8% for the first time since 2000" in October 2023, a reading from its own lender survey, explained further down this report.
Today's rates and the 2026 rise, week by week
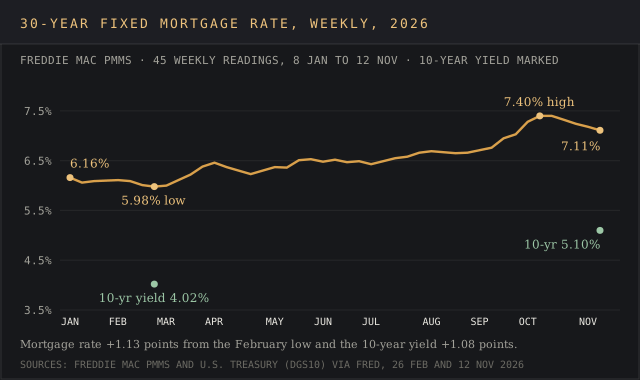
Rates moved in two halves from the beginning of 2026. They opened the year at 6.16% on 8 January and fell to 5.98% on 26 February, the only sub-6% reading of the year. From there they rose for most of the next 32 weeks, reaching 7.40% on 8 and 15 October. The first break above 7% came on 24 September, at 7.03%.
Four straight weekly declines followed: 7.32%, 7.24%, 7.18% and 7.11%. The 15-year fixed rate stood at 6.45% on 12 November, against 5.49% a year earlier, per Freddie Mac. The 15-year fixed mortgage ran 0.66 points lower than the 30-year that week.
Want a weekly rate chart like this for your own market? Send the series and the years.
Email a briefTwo things moved in 2026. The 10-year Treasury yield went from 4.02% on 26 February to 5.10% on 12 November, and the Fed raised the top of its target range from 3.75% to 4.00% in September. By 10 September, before the hike, the 30-year rate had already climbed from 5.98% to 6.76%, so treasury yields did most of the work.
The monthly averages below cover every month since January 2021, the record-low month, through October 2026.
| Month | Average 30-year fixed rate |
|---|---|
| January 2021 | 2.74% |
| February 2021 | 2.81% |
| March 2021 | 3.08% |
| April 2021 | 3.06% |
| May 2021 | 2.96% |
| June 2021 | 2.98% |
| July 2021 | 2.87% |
| August 2021 | 2.84% |
| September 2021 | 2.90% |
| October 2021 | 3.07% |
| November 2021 | 3.07% |
| December 2021 | 3.10% |
| January 2022 | 3.45% |
| February 2022 | 3.76% |
| March 2022 | 4.17% |
| April 2022 | 4.98% |
| May 2022 | 5.23% |
| June 2022 | 5.52% |
| July 2022 | 5.41% |
| August 2022 | 5.22% |
| September 2022 | 6.11% |
| October 2022 | 6.90% |
| November 2022 | 6.81% |
| December 2022 | 6.36% |
| January 2023 | 6.27% |
| February 2023 | 6.26% |
| March 2023 | 6.54% |
| April 2023 | 6.34% |
| May 2023 | 6.43% |
| June 2023 | 6.71% |
| July 2023 | 6.84% |
| August 2023 | 7.07% |
| September 2023 | 7.20% |
| October 2023 | 7.62% |
| November 2023 | 7.44% |
| December 2023 | 6.82% |
| January 2024 | 6.64% |
| February 2024 | 6.78% |
| March 2024 | 6.82% |
| April 2024 | 6.99% |
| May 2024 | 7.06% |
| June 2024 | 6.92% |
| July 2024 | 6.85% |
| August 2024 | 6.50% |
| September 2024 | 6.18% |
| October 2024 | 6.43% |
| November 2024 | 6.81% |
| December 2024 | 6.72% |
| January 2025 | 6.96% |
| February 2025 | 6.84% |
| March 2025 | 6.65% |
| April 2025 | 6.73% |
| May 2025 | 6.82% |
| June 2025 | 6.82% |
| July 2025 | 6.72% |
| August 2025 | 6.59% |
| September 2025 | 6.35% |
| October 2025 | 6.25% |
| November 2025 | 6.24% |
| December 2025 | 6.19% |
| January 2026 | 6.10% |
| February 2026 | 6.05% |
| March 2026 | 6.18% |
| April 2026 | 6.33% |
| May 2026 | 6.44% |
| June 2026 | 6.49% |
| July 2026 | 6.54% |
| August 2026 | 6.67% |
| September 2026 | 6.86% |
| October 2026 | 7.35% |
- The country, loan type or lender set to cover
- Regions, years and segments
- Where it runs: blog, white-label, gated or lead magnet
- Whose byline goes on it
- Deadline
- 2,500+ words, human-written
- Every figure linked to its source
- Yours to publish, under your name or none
- Hosting here for +$200, with your sponsored links
Why published mortgage rate series disagree
Each mortgage rate series is built for a particular purpose, so two honest sources rarely match to the decimal. Freddie Mac averages purchase applications submitted to it by lenders. Bankrate averages rates from its own survey of lenders. The gap between them has run from a few hundredths of a point to more than a quarter point a year. Our guide to data triangulation covers how to check one source against another.
In recent years Bankrate's annual average came in higher than Freddie Mac's in every year after 1998 in the table, by 0.06 to 0.27 points, and Freddie Mac's lower figure is the one FRED republishes.
| Year | Freddie Mac PMMS (FRED average) | Bankrate survey | Gap |
|---|---|---|---|
| 1998 | 6.94% | 6.91% | -0.03 |
| 2010 | 4.69% | 4.86% | +0.17 |
| 2020 | 3.11% | 3.38% | +0.27 |
| 2021 | 2.96% | 3.15% | +0.19 |
| 2022 | 5.34% | 5.53% | +0.19 |
| 2023 | 6.81% | 7.00% | +0.19 |
| 2024 | 6.72% | 6.90% | +0.18 |
| 2025 | 6.60% | 6.66% | +0.06 |
Bankrate's mortgage rates history page says it began aggregating its own rate data in 1982 and uses Freddie Mac figures for the years before. That's why the two sources agree to the decimal for 1972 to 1981 and part ways after. On 4 November 2026, Bankrate put the 30-year average at 7.26%. Freddie Mac's reading for the week of 5 November was 7.18%.
The 8% question from October 2023 is the same gap in miniature. Bankrate's survey crossed 8%, while Freddie Mac's weekly high that month was 7.79%. Both are correct for their own method and their own date.
Republishers add a third layer. Rocket Mortgage's history article, published by Rocket Mortgage, LLC, credits the primary mortgage market survey and lists 2025 at 6.47%, where averaging the same year's weekly rates through FRED gives 6.60%. The devil's in the details, so check which weeks and which date range a republished annual figure covers before you cite it, one of the checks in our source credibility guide.
The FHFA's national average contract mortgage rate measured something else again. It came from a monthly survey of lenders, including savings banks, commercial banks and mortgage companies, and lagged the market because closed loans often reflect commitments made two or three months earlier. Its last published value is 4.12% for January 2018.
How Freddie Mac's primary mortgage market survey is built
Freddie Mac's methodology notes say PMMS rates "are based on applications submitted to Freddie Mac for the given week from lenders across the country." Since 17 November 2022, the data comes from Freddie Mac's Loan Product Advisor system, where it used to come from a lender survey.
- The survey covers conventional, single-family purchase applications within the conforming loan limits FHFA sets.
- The borrower profile, in Freddie Mac's words, is "good/excellent credit, 20% loans, home purchase loans on owner occupied 1-unit single-family properties."
- Results come out on Thursdays at 12 p.m. ET, averaging rates from the prior Thursday through Wednesday, and on Wednesday when a U.S. holiday falls on a Thursday.
- The 30-year fixed runs from April 1971 and the 15-year fixed from 1991. Adjustable rates and fees or points were dropped in November 2022.
Freddie Mac publishes its data "on an 'as is' basis, with no warranties of any kind whatsoever," and says it doesn't guarantee the content is accurate, current or suitable. Its stated citation rule is that the information "may be used with proper attribution." For accuracy in your own work, give a full citation with the survey name and the week's release date, and treat weekly rates as an average across thousands of applications submitted that week.
Each weekly figure carries a release date, and FRED dates the observation to the Thursday it covers. A rate built for that particular purpose won't match the quote one borrower receives.
What drives mortgage rates: Treasury yields, the Fed and inflation
The Federal Reserve Bank of St. Louis writes the relationship as a formula, in which the mortgage rate roughly equals the Treasury yield plus a mortgage spread. In its October 2026 Page One Economics article, Amanda Geiger explains that the 10-year note is the benchmark because the average mortgage is paid off or refinanced well before 30 years, closer to 10.
The 10-year yield is set in the bond market, based on investors' expectations for inflation and growth, per the same article. On 12 November 2026 the spread was 2.01 points, with 7.11% against a 10-year yield of 5.10%. The spread covers the risk investors take on with mortgage-backed securities plus origination, servicing and lender profit.
On 12 November 2026 the 30-year mortgage rate sat 2.01 points above the 10-year Treasury yield, 7.11% against 5.10%, per Freddie Mac and FRED.
Gap between the 30-year mortgage rate and the 10-year Treasury yield, 12 November 2026
Source: Freddie Mac and FREDe.g. mortgage spreads in your country
Source: linked, checked, datedFed policy sets the overnight federal funds rate and reaches mortgage borrowing costs only indirectly, through expectations about inflation and future short-term rates. In 2022 the mortgage rate moved first. It rose from 3.22% on 6 January to a March average of 4.17% as the Fed lifted its target from 0.25% that month, then reached 7.08% on 27 October and again on 10 November 2022.
Inflation drove the 1979 to 1981 peak, the case economists still cite. Prices rose 11.3% in 1979 and 13.5% in 1980 by the CPI, and the annual mortgage rate went from 9.64% in 1978 to 11.20% in 1979 and 16.64% in 1981. Rates didn't fall back below 10% as an annual average until 1991, a decade after the peak.
What each rate level means for a monthly payment
The table shows principal and interest on a $400,000, 30-year fixed loan at rates from the record. It leaves out taxes, insurance and fees, which add to the real monthly payment.
| Rate | When | Monthly principal and interest | Total interest over 30 years |
|---|---|---|---|
| 2.65% | Record low, 7 January 2021 | $1,612 | $180,268 |
| 3.11% | 2020 annual average | $1,710 | $215,686 |
| 6.24% | 13 November 2025 | $2,460 | $485,696 |
| 7.11% | 12 November 2026 | $2,691 | $568,697 |
| 7.79% | 26 October 2023 | $2,877 | $635,617 |
| 16.64% | 1981 annual average | $5,586 | $1,610,935 |
| 18.63% | Record high, 9 October 1981 | $6,234 | $1,844,359 |
A year of rate movement costs $231 a month on this loan, or $2,767 a year, compared with a borrower who locked 6.24% in November 2025. Against the 2021 low, the monthly payment is $1,079 higher. An owner holding a 2.65% loan would give up those savings by choosing to refinance the same balance at 7.11%, so the math favors keeping the old loan. A borrower who took 7.79% in October 2023 and can refinance at 7.11% cuts $186 a month.
Every figure in the table is an estimate of principal and interest only, based on a standard amortization formula. Before you borrow, shop at least three lenders and compare the full fee sheet, since quoted rates and fees vary by lender, credit score and down payment. For advice on a specific loan, a lender's written estimate is the document to compare.
For the full cost picture beyond the rate, our real estate statistics report covers prices, sales volumes and inventory, and the real estate data providers ranking compares the vendors that sell property and loan-level data. Our real estate market intelligence guide covers the tools investors use for rent comps and market trends.
Mortgage statistics beyond the rate
Household finances show the other side of the rate. The New York Fed's Q3 2026 Household Debt and Credit Report, published on 10 November 2026, shows how much mortgage debt the country carries at these rates.
- Mortgage balances reached $13.374 trillion, up $257 billion in the quarter and $302 billion in a year.
- Lenders originated $595 billion of new mortgages in Q3 2026, higher than the $512 billion of Q3 2025.
- Home equity lines of credit rose $23 billion to $481 billion, the largest quarterly increase since 2005.
- About 62,000 borrowers had a new foreclosure added to their credit report in the quarter.
- Total household debt came to $19.105 trillion, with 5.0% of it in some stage of delinquency.
Mortgage balances fell $74 billion in the second quarter before the third-quarter rise, so the year-on-year figure is the steadier read. The originations figure counts purchase and refinance loans together, and our credit market intelligence guide covers how lenders monitor defaults and price credit risk.
For homeownership and property data at company level, the ATTOM review covers one of the larger property-record vendors, and the real estate intelligence platforms ranking compares CoStar, Reonomy, HouseCanary and six more.
November mortgage rates, 2016 to 2026
November 2026 is running at the second-highest November average of the past 11 years. The 2026 figure is based on the first two weekly readings, 7.18% and 7.11%.
| Month | 30-year fixed, monthly average |
|---|---|
| November 2016 | 3.77% |
| November 2017 | 3.92% |
| November 2018 | 4.87% |
| November 2019 | 3.70% |
| November 2020 | 2.77% |
| November 2021 | 3.07% |
| November 2022 | 6.81% |
| November 2023 | 7.44% |
| November 2024 | 6.81% |
| November 2025 | 6.24% |
| November 2026 (two weeks) | 7.15% |
Delivered for your site and your byline. Hosting here is optional.
Frequently asked questions
Why was the mortgage rate so low in 2020?
The Fed cut the top of its target range to 0.25% in March 2020 and bought Treasuries and mortgage-backed securities, which the St. Louis Fed notes raises their prices and lowers their yields. Lower yields fed through to low rates across the country. The 30-year rate averaged 3.11% in 2020 and reached its 2.65% low on 7 January 2021.
Is 4.7 a good mortgage rate?
A 4.7% rate sits below every annual average from 1971 to 2009 and below every annual average since 2022. It's higher than every year from 2010 through 2021. That makes it a good rate for most of the record and a high one for the low-rate decade.
Will mortgage rates get to 4% in 2026?
Freddie Mac's lowest weekly reading of 2026 was 5.98% on 26 February, and the rate stood at 7.11% on 12 November. The last monthly average under 4% was February 2022, at 3.76%, so a 4% rate this year is a long shot on Freddie Mac's own data.
Will mortgage rates be 3% again?
The last monthly average below 3% was September 2021, at 2.90%. Those rates came with a federal funds target capped at 0.25%. The cap stood at 4.00% in October 2026.
Will mortgage rates go down to 5%?
The last monthly average under 5% was April 2022, at 4.98%. Keep an eye on the 10-year Treasury yield. At the 2.01-point spread recorded on 12 November 2026, a 5% mortgage rate implies a 10-year yield near 3%, about 2.1 points lower than the 5.10% recorded that day.
What has been the highest mortgage rate in the last 10 years?
7.79% on 26 October 2023, in Freddie Mac's weekly data. The highest monthly average in that window was 7.62% in October 2023.
Are mortgages declining?
Mortgage balances rose $257 billion in Q3 2026 to $13.374 trillion, after a $74 billion dip in Q2, according to the New York Fed. Originations rose to $595 billion from $512 billion a year earlier.
What salary do you need for a $400,000 mortgage?
At 7.11%, principal and interest on $400,000 come to $2,691 a month. A household spending 28% of gross income on that payment alone would need $115,321 a year, before taxes, insurance and any other debt are counted.
Bottom line
Mortgage rates history splits into three eras: the 1980s, when the decade averaged 12.70%; the 2010s at 4.09%; and the years since 2022, when annual averages have held between 5.34% and 6.81%. At 7.11%, this week's rate sits under the 50-year average of 7.64%, and it reads as high mainly to borrowers who remember 2021.
Name the series and the date for any figure you cite, because Freddie Mac's weekly survey and Bankrate's lender survey differed by 0.19 points in 2021, 2022 and 2023. Freddie Mac's series runs back to April 1971, and its data is free on FRED. The quickest way to compare today's rates with history is FRED's MORTGAGE30US series, where every weekly reading since April 1971 sits in one download.
Lenders, brokers and property data vendors publish reports like this one as lead magnets and client briefs.
A report on your topic for a blog page, gated content or a lead magnet.
Written for your client and published under their brand, with my name left off.
Your report on marketintelligencetools.com, with 2 to 3 CTAs carrying your sponsored links.
Default terms: the report is yours to publish, and I keep the right to republish it on this site behind a gate, outside Google's index.
Where every rate on this page comes from, and the borrower quote no series records
Weekly, monthly and annual 30-year and 15-year fixed rates: freddiemac.com (Primary Mortgage Market Survey and its methodology notes) and fred.stlouisfed.org (MORTGAGE30US). Annual, decade and monthly averages are our calculations from the weekly readings, through 12 November 2026.
Treasury yields, the federal funds rate and inflation: fred.stlouisfed.org (DGS10, FEDFUNDS, DFEDTARU, CPIAUCSL) and stlouisfed.org (Page One Economics, October 2026). Comparison series: bankrate.com (historical mortgage rates, read 4 November 2026), rocketmortgage.com (historical 30-year fixed rates) and fhfa.gov (national average contract mortgage rate, last value January 2018).
Balances, originations, home equity lines and foreclosures: newyorkfed.org (Household Debt and Credit Report, Q3 2026, published 10 November 2026). Monthly payments and lifetime interest are our standard amortization of a $400,000, 30-year loan, principal and interest only.
Every figure was checked against its source on 17 November 2026. No series records the rate an individual borrower is quoted, which depends on credit score, down payment, points and lender fees.