BCG Matrix Template
 By Jan Suski. I go deep on every review, checking every number against its source and digging up details other coverage misses, a habit from six years of SEO and link building for tech companies. Bylines at Surfer, Brand24, and Senuto. How the scoring works.
Get the BCG matrix template
An Excel workbook that calculates relative market share and market growth rate for every product line, labels each one star, cash cow, question mark or dog, and plots the portfolio as a bubble chart.
Download XLSXA BCG matrix template is a two-by-two grid that plots every product or business unit by two numbers: relative market share on the horizontal axis and market growth rate on the vertical axis. The four quadrants it produces (stars, cash cows, question marks and dogs) tell a business where cash comes from and where it should go next.
This page gives you a free Excel workbook with live formulas, then covers what the Boston Consulting Group built the growth share matrix to do, how to calculate both axes, a step-by-step fill-in guide, a BCG matrix example for a five-brand food maker, and the limits of the model.
It's written for the people who split a budget across a product portfolio: a product marketing lead preparing the annual plan, a strategy analyst asked for a portfolio analysis by Friday, or a founder with three products and one engineering team. Students writing a strategic management essay will find the calculations spelled out too.
The reason to run one is cash. The BCG matrix was designed around cash flows, and a portfolio drawn without it tends to fund whatever product shouts loudest. The template puts a number on each product line, so the argument about where the lion's share of investment goes starts from market data.
Download the free BCG matrix template
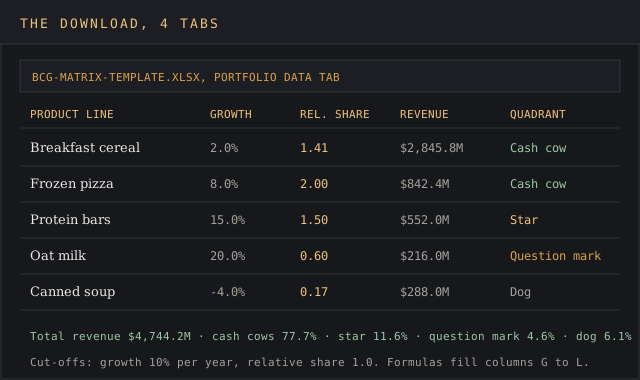
Download the BCG matrix template (XLSX)Four tabs covering portfolio data with live formulas, the four-quadrant matrix with a bubble chart, and a portfolio balance view, pre-filled with the Northfield Foods worked example.
The workbook has four tabs: instructions, portfolio data with the calculations, the BCG matrix itself with a bubble chart, and a portfolio balance summary. Every tab ships pre-filled with the Northfield Foods worked example below, so you can see the formulas produce a result before you clear the inputs for your own business units.
The file opens in Excel, Google Sheets and LibreOffice Calc. Every calculation uses plain IF, AND, SUMIF and COUNTIF formulas, so nothing breaks on import, and the chart needs no paid add-on.
What the BCG matrix is
The BCG matrix, also called the BCG growth share matrix, the Boston box or the product portfolio matrix, is a portfolio management framework from the Boston Consulting Group. BCG's own history page says Alan Zakon, later the firm's CEO, first sketched it and refined it with colleagues, and that founder Bruce Henderson popularized the concept in his 1970 essay The Product Portfolio.
Wikipedia's entry describes the grid as a collaborative effort by BCG employees and places Henderson's essay in BCG's Perspectives series. It spread fast. BCG says that at the height of its success the growth share matrix was used by about half of all Fortune 500 companies.
The idea underneath it is older. Henderson's 1968 essay on the experience curve argued that unit costs fall by a characteristic 20 to 30% each time accumulated production doubles. The market leader accumulates experience fastest, so a high market share should bring a cost advantage relative to every rival, and with it large cash flows.
That's the logic of the whole grid. Market share predicts how much cash a product generates. Market growth predicts how much cash it consumes to hold its position. Put the two together and you have a map of cash consumption and cash generation across the product portfolio.
The four quadrants of the BCG matrix
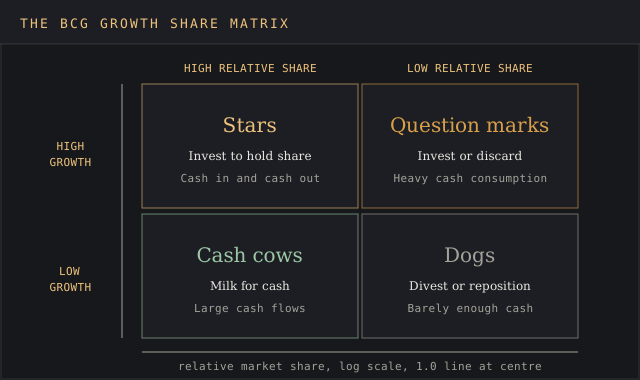
Each quadrant pairs one share reading with one growth reading. The table below uses BCG's own instructions for each, quoted from its history page.
| Quadrant | Market growth | Relative market share | Cash pattern | BCG's instruction |
|---|---|---|---|---|
| Stars | High growth | High market share | Large cash flows in and out | Invest, because they have high future potential |
| Cash cows | Low growth | High market share | Generate large cash flows, need little | Milk for cash to reinvest |
| Question marks | High growth | Low market share | Heavy cash consumption, little return yet | Invest or discard, depending on the chance of becoming stars |
| Dogs | Low growth | Low market share | Barely enough cash to sustain themselves | Liquidate, divest or reposition |
Stars
Stars hold a high market share in a high growth market. Corporate Finance Institute puts it plainly: stars consume a large amount of cash but also generate large cash flows. A star needs that spend to fight competitors for new buyers while the market still grows. When growth slows, a star that held its share becomes a cash cow.
Cash cows
Cash cows sit in the cash cow quadrant: high market share, low market growth. They're the market leader in a mature market, so they need little investment to defend a strong position. CFI says cash flows from cash cows are generally used to finance stars and question marks. Every balanced portfolio needs one, because it pays for everything else on the chart.
Question marks
Question marks, also called problem children, have low market share in rapidly growing markets. They burn cash to keep up with high market growth and haven't won the share to earn it back. CFI notes that question marks that never become a market leader end up as dogs when market growth declines. Most question marks are a long shot, and the portfolio review decides which deserve the money.
Dogs
Dogs combine low market share with low market growth. BCG now calls them pets. They usually earn barely enough cash to keep going and tie up management time that other business units could use. Every dog has its day, though: a dog that completes a product line or keeps a key retailer stocked can earn its place on strategic grounds.
BCG's own conclusion is blunt. Its history page says all products will eventually become either cash cows or pets, which is why the matrix treats today's stars as tomorrow's cash generators.
How to calculate relative market share and market growth rate
Both axes come from data a market intelligence team already collects. The formulas are short, and the devil's in the details of how you define the market before you divide anything.
Relative market share
Wikipedia calls this the exact measure of competitive position: the brand's share relative to its largest competitor. For a company that leads its market, the comparison runs against the number two player.
- Formula: relative market share = your business's market share / market share of the largest competitor.
- Reading: a score above 1.0 means you are the market leader. A score of 1.0 means parity, and anything under 1.0 means a rival is bigger.
- Wikipedia's three cases: a 20% share against a 20% rival is 1:1; against a 60% rival it's 1:3, a relatively weak position; against a 5% rival it's 4:1, a relatively strong position.
Wikipedia also notes the horizontal axis is drawn on a logarithmic scale in practice, so a 4.0 and a 0.25 sit the same distance from the 1.0 line. If you need the raw share figures first, the market share calculator turns company and market revenue into a percentage.
Market growth rate
Market growth rate is the year-on-year change in total market size, expressed as an annual percentage: (this year's market size minus last year's) divided by last year's. Use total market size from one source for both years. A product's own sales can grow 30% while its market shrinks, and the vertical axis would then lie about market attractiveness.
The cut-off point between high and low growth is usually 10% per year. Wikipedia says the cut-off point is usually chosen as 10 per cent per annum, and CFI applies the same line. A market growing at 3% is a low market growth rate; one at 15% counts as a high growth market. Pick a cut-off point that fits your industry, then hold it fixed across the whole chart.
A CAGR calculator smooths a lumpy multi-year series into one rate if a single year looks distorted by a one-off event.
Define the market before you calculate anything. A craft brewer measured against all beer has a tiny share; measured against regional craft beer it may lead. The quadrant changes with the definition, so write the definition into the template next to each product.
How cash moves between the quadrants
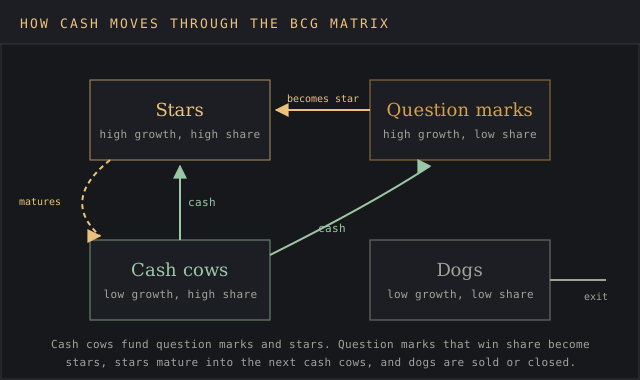
The growth share matrix is a cash plan drawn as a grid. Cash cows hold a high relative market share in low market growth, so they throw off more money than they need. That surplus is the cash needed to fund question marks and stars in high market growth, where investment required runs ahead of what they earn.
The Boston Consulting Group designed it to move in one direction. Money flows from cash cows to the most promising question marks, those question marks become stars, and as the market matures the stars become the next cash cows. Dogs and question marks that stall get sold or closed, freeing cash for the units with the most value left to capture.
A fast growing industry with no cash cow in the portfolio is the warning sign. Every unit then competes for outside funding, and the market position of all of them depends on the next round of capital. A cash cow with no question marks behind it has the opposite problem: strong cash flows today and no growth potential for the next cycle.
What's inside the template
| Tab | What it holds | Key formula |
|---|---|---|
| Instructions | How to fill each column, the two cut-offs and the quadrant rules | None |
| Portfolio Data | One row per product: market size last year and this year, your share, largest competitor's share, then market growth rate, revenue, relative market share, quadrant and suggested move | =IF(AND(H6>=Growth_Cutoff,J6>=Share_Cutoff),"Star",...) |
| BCG Matrix | The four quadrants with product count and revenue in each, plus a bubble chart with relative market share on a reversed log axis | =COUNTIF(Quadrant,"Cash cow") |
| Portfolio Balance | Revenue per quadrant and its share of the total, so a lopsided portfolio shows up as a number | =SUMIF(Quadrant,"Star",Revenue)/SUM(Revenue) |
The two cut-offs live in named cells on the Instructions tab, 10% for growth and 1.0 for relative share. Change either and every quadrant label, count and chart point updates together.
How to fill in a BCG matrix, step by step
- List the products or business units. One row per unit you could fund or cut separately. Mixing a brand with a whole division on one chart distorts both.
- Define each unit's market. Write the definition in the market definition column. Most bad charts are built on a market drawn too wide or too narrow.
- Enter market size for two years. Use the same source for both years. A market sizing template or analyst report gives the totals; the sheet calculates market growth.
- Enter your share and the largest competitor's share. The sheet divides one by the other for relative market share.
- Read the quadrant and suggested move. The sheet compares both numbers to the cut-offs and labels each unit star, cash cow, question mark or dog.
- Check the Portfolio Balance tab. If one quadrant holds most of the revenue, that's the starting point of the discussion.
- Decide, then date it. Mark each unit invest, hold, harvest or divest, save the file with the date, and rerun it next year.
BCG matrix example: a five-brand food maker
Northfield Foods is a fictional packaged-food company built for this BCG matrix example, with $4.74 billion in sales across five product lines. The market sizes and shares below are the exact values pre-filled in the download, so every number on this page matches the spreadsheet.
| Product line | Market last year | Market this year | Growth rate | Our share | Largest competitor | Relative share | Revenue | Quadrant |
|---|---|---|---|---|---|---|---|---|
| Breakfast cereal | $9,000M | $9,180M | 2.0% | 31% | 22% | 1.41 | $2,845.8M | Cash cow |
| Frozen pizza | $3,000M | $3,240M | 8.0% | 26% | 13% | 2.00 | $842.4M | Cash cow |
| Protein bars | $2,000M | $2,300M | 15.0% | 24% | 16% | 1.50 | $552.0M | Star |
| Oat milk | $1,000M | $1,200M | 20.0% | 18% | 30% | 0.60 | $216.0M | Question mark |
| Canned soup | $5,000M | $4,800M | -4.0% | 6% | 35% | 0.17 | $288.0M | Dog |
Breakfast cereal is the textbook cash cow: 31% of a market growing 2.0% a year, 1.41 times the size of its largest competitor. Frozen pizza shares the cash cow quadrant at 8.0% growth, just under the 10% cut-off point, which makes it the unit to watch. One more good year in that market moves it into stars.
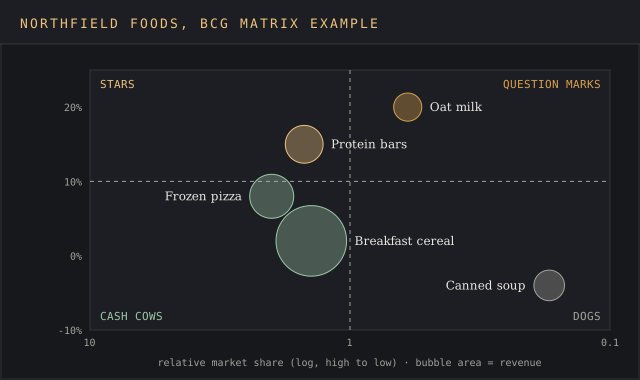
Protein bars lead a market expanding 15.0% a year at 1.50 relative share, a star. Oat milk is the classic question mark: 20.0% growth but only 0.60 of the leader's share, and closing that gap means a heavy marketing strategy spend to grow market share against a rival holding 30%. Canned soup holds 6% of a shrinking market, a dog at 0.17.
The Portfolio Balance tab shows the cash cow quadrant carrying $3,688.2M, 77.7% of revenue. Stars hold 11.6%, the question mark 4.6% and the dog 6.1%. That's a portfolio living off two cash cows, with one star coming through. Northfield has put most of its eggs in one basket, and a cereal market expanding 2.0% a year won't fund that forever.
The resulting plan follows BCG's instructions. Harvest cereal and frozen pizza to fund growth opportunities, invest in protein bars to hold leadership, give oat milk one funded year to gain market share and cut your losses if relative share stays under 0.60, and put canned soup up for sale. The plan then moves into a go-to-market plan with owners and dates.
Limitations of the BCG matrix
A BCG matrix runs on two numbers, two numbers can't describe a business, and the critics of the Boston Consulting Group model have documented where it breaks. The template keeps a market definition column for exactly this reason.
- It ignores external market factors. Canva's guide notes it doesn't consider demographics, customer demand, trends or technology.
- High market share doesn't guarantee profit. The same guide says it assumes high market share means profitability, and a price war can give a leader the volume and none of the margin.
- It's a snapshot. Wikipedia records criticism of the model as static, because the business environment keeps changing.
- It disregards synergies between units, so a dog that sells alongside one of the cash cows looks worse than it is.
- The results are mixed. Wikipedia cites a 1992 study by Slater and Zwirlein that found firms following portfolio planning models like the BCG matrix had lower shareholder returns.
It also oversimplifies product performance. Wikipedia says later practitioners tended to over-simplify its messages, and the 10% and 1.0 lines are conventions, so any unit near either boundary should be analyzed carefully before anyone acts on its label.
BCG matrix vs the Ansoff and GE-McKinsey matrices
The BCG matrix sorts existing products by cash position. The Ansoff matrix template sorts proposed expansion moves by product and market newness, so the two run in sequence: the BCG chart shows which units supply the cash, and the Ansoff grid ranks where that cash goes next.
The GE-McKinsey matrix, built by McKinsey for General Electric in the early 1970s, has nine cells. It replaces market growth with an industry attractiveness score built from nine measures and replaces relative market share with a business strength score built from twelve. That's 21 scored inputs per unit against BCG's two. A SWOT analysis or PEST analysis fills in the external factors the BCG grid leaves out.
Excel, Google Sheets or a BCG matrix maker
A spreadsheet is the right home for a BCG matrix, because both axes are calculations. Online whiteboards and drag-and-drop diagram tools draw a nice grid, but every bubble is placed by hand, so the chart drifts from the data the moment someone updates a share figure.
- Excel: full support, including the bubble chart with a log-scale horizontal axis.
- Google Sheets: the formulas and quadrant labels import cleanly; the chart may need its axis set back to log scale.
- Slides or a whiteboard: fine for the final one-page summary, copied from the BCG Matrix tab.
That's how the BCG matrix work splits in practice: calculations live in the sheet, and the deck gets a copy of the chart.
FAQ
What is the BCG matrix?
A portfolio analysis tool from the Boston Consulting Group that plots each product by relative market share and market growth rate, sorting them into stars, cash cows, question marks and dogs to show which products fund the others.
What are the four quadrants of the BCG matrix?
Stars (high growth, high market share), cash cows (low growth, high market share), question marks (high growth, low market share) and dogs (low growth, low market share). BCG now calls dogs pets.
How to calculate relative market share in BCG matrix?
Divide your market share by the market share of your largest competitor. A result above 1.0 makes you the market leader; 0.5 means the leader is twice your size.
How do I create a BCG matrix?
List your business units, define each market, collect two years of market size and the current shares, then calculate market growth and relative share. Plot each unit against a 10% growth line and a 1.0 share line, or let the template do it.
What is the BCG growth matrix used for?
To allocate resources across a product portfolio: which units to invest in, which cash cows to harvest, and which to sell. It's a marketing strategy and business strategy tool used in annual planning.
What is the BCG matrix of Coca-Cola?
Coca-Cola doesn't publish one. Any chart you find for its brands is an outside estimate, and the quadrant depends on the market definition: its flagship cola measured against all beverages and against cola alone gives two different relative market shares.
Is BCG better than McKinsey?
They answer different questions. The Boston Consulting Group's matrix uses two measured numbers and four cells; the GE-McKinsey matrix uses scored composites and nine cells. BCG takes two data points per unit, and the McKinsey grid takes 21 scored measures per unit, which captures more factors and adds more judgment.
Is the BCG matrix still relevant?
Yes, as a first pass. The Boston Consulting Group revisited it in 2014 and still teaches it, and the cash logic holds: cash cows still pay for the next generation of products. Pair it with a SWOT or PEST, and rerun it every year, because quadrant positions shift as markets grow and slow.
Bottom line
Reach for this template when you have several products or business units competing for one budget and need to show where cash comes from and where it goes. It's fast, it runs on two numbers you can source, and it makes a lopsided product portfolio, too many cash cows or none at all, visible in one chart.
It won't size a new market, rank new expansion ideas or explain why a product is losing share. Those questions belong to a market sizing template, the Ansoff matrix and a competitive analysis template, and the BCG matrix tells you which of them to open first.