Market mapping: how to build a market map your team can defend
 By Jan Suski. I go deep on every review, checking every number against its source and digging up details other coverage misses, a habit from six years of SEO and link building for tech companies. Bylines at Surfer, Brand24, and Senuto. How the scoring works.
The short version 12 points · 50 seconds
- 01A market map plots one market on a shared frameCrowded corners and empty space in one view
- 02Four map types answer four different questionsLandscape, positioning, share-growth, talent
- 03The written market definition comes firstOne sentence: buyer, job and geography
- 04Axes should be trade-offs customers makePrice against quality plots a diagonal
- 05Gartner's Magic Quadrant is a two-axis market mapAbility to Execute, Completeness of Vision
- 06Six source types feed a market map's dotsFilings, reports, databases, sites, reviews, jobs
- 07Q2 2026 cloud infrastructure hit $143.4 billionAmazon 28%, Microsoft 20%, Google 15%
- 08Mixing reporting scopes breaks the growth axisGoogle Cloud's 82% includes Workspace
- 09An empty quadrant is a hypothesis to testCheck it against demand evidence first
- 10Hiring data adds a forward-looking layerRecruiters map talent pools the same way
- 11Roger Martin warns maps hide what sits outsideVanguard's index funds came from off the map
- 12Redraw on a schedule, since markets move fastMartech lost 1,211 tools and added 2,489
Market mapping is the practice of plotting the companies in one market against a shared set of dimensions, so businesses can identify who competes with whom, where the crowd sits and where nobody does. The output, a market map, is a single picture that replaces a spreadsheet of fifty competitors and a dozen opinions about them.
This lesson covers the four kinds of market map, how to choose axes customers would recognize, where the data comes from, how to read gaps without fooling yourself, and a worked example with Q2 2026 cloud figures. It's written for product marketers, founders and analysts who have to put a competitive market map in front of people who'll make informed decisions from it.
It follows the previous lesson in Path 3D, on digital trend marketing and the four tests a trend passes. That lesson sorted market trends and industry trends from noise. This one places the companies and competitors those trends act on.
What market mapping is, and what a market map leaves out
Harvard Business School's Baker Library describes market mapping as visually organizing information about the competitors in a specific industry or vertical, to understand their positions and spot trends (HBS Baker Library). That definition carries two jobs. One is inventory: knowing all the key players, including the indirect competitors a sales team never meets in a deal. The other is position: knowing where each one sits relative to the rest.
Market mapping and competitor analysis do different work. A competitor analysis goes deep on five or six direct competitors: their pricing, offerings, strengths, weaknesses and threats to your position.
Market mapping goes wide and shallow, and its value comes from seeing the whole competitive landscape at once. A picture is worth a thousand words here only when the picture is complete, and a map missing a third of the market sends readers to the wrong conclusion with a chart to back it.
A map also leaves things out by design. It shows positions at one moment and says little about why customers pick one supplier over another, or how their needs are changing. That's the job of the interviews and win-loss work covered in customer intelligence, and a good market map points you toward which customers to ask.
The benefits of market mapping show up in several ways. Businesses use it to identify gaps, to get a better understanding of the market landscape before entering it, to brief a new hire in one meeting, and to test a strategy against the competitors it has to beat. Visual representations also travel: a market map survives in a board deck, where readers skip a 40-row table.
Four kinds of market map, and the question each answers
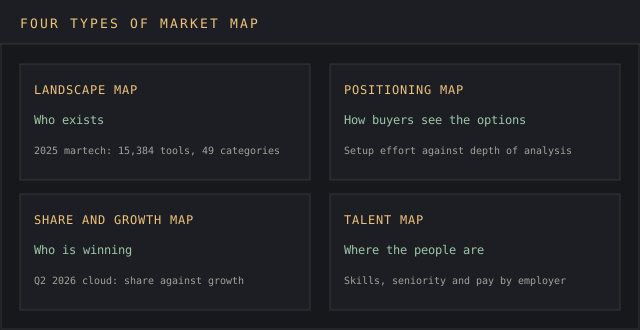
People use "market map" for at least four different pictures. Pick the one that answers the question on the table, because each needs different data, a different market mapping process and a different amount of work.
Landscape map: who exists
A landscape map, sometimes called a category map, sorts companies into labeled boxes by what they sell. Scott Brinker's marketing technology landscape is the best-known example: the 2025 edition holds 15,384 solutions in 49 categories, up from 14,106 in 2024 and from about 150 in the first official edition (chiefmartec).
Investors use the format to scout a sector. The HBS guide lists PitchBook and S&P Capital IQ Pro as two databases that ship prebuilt market maps, and PitchBook can also segment a custom company screen into one.
Positioning map: how buyers see the options
A positioning map, also called a perceptual map, plots brands on two axes that matter to customers, such as price and depth of features. Its points come from survey ratings in consumer markets or from scored product facts in B2B ones. The site's free perceptual map template has the two-axis grid ready to fill in, and it's the right format when the question is positioning against similar products.
Share and growth map: who's winning
This version plots market share on one axis and growth rate on the other, the logic of the old BCG growth-share matrix applied to rivals. It needs harder data, revenue by company, so it suits markets where filings or research firms publish shares. The worked example further down is one.
Talent map: where the people are
Recruiters use market mapping to chart the people in a target market before a role opens: who works where, at what level, with which skills. The output is a talent map, and it gets its own section below, because the hiring data behind it also feeds the competitive version.
Define the market before you plot anyone
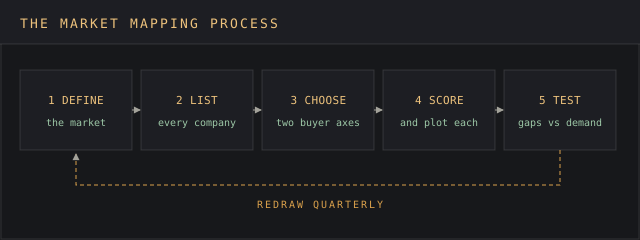
The first step in the market mapping process is a written market definition, and it decides more of the final picture than any axis. Lesson 3D.1, market analysis and competition, sets a market's edges with the hypothetical 5% price-rise test. Use the same edges here, so the map and the concentration numbers describe one market.
Draw the boundary too wide and the target market dissolves: a map of "cloud" puts Salesforce next to AWS. Draw it too narrow and the indirect competitors drop off, which is the blind spot market mapping exists to fix. Write the boundary as one sentence naming the buyer, the job and the geography, for example "US mid-market companies buying email deliverability tools."
Then collect information on every company. Start from industry reports, analyst maps and investor databases, add the names your sales team loses deals to, and finish with manual research: search results, review sites, conference sponsor lists and app marketplaces. In a young category this step is a needle in a haystack, and in a mature one it's a treasure hunt for the one fast-growing competitor that flew under the radar.
Choose axes from what customers trade off
Axes are where most market mapping goes wrong, and choosing them is the biggest of the challenges in this lesson.
Price against quality is the reflex choice, but nearly every customer wants low price and high quality, so the chart becomes a diagonal line with little to learn from it. Every company sitting on one diagonal is a red flag that the two axes measure the same thing. Good axes are two dimensions customers trade against each other and that move independently: setup effort against depth of analysis, self-serve against sales-led, breadth of data against freshness.
To find candidates, start from customer feedback: win-loss notes, complaints on review sites and the questions prospects ask in demos. Each candidate has to split the market. If nine of ten companies score high on it, it can't separate anyone, so drop it and test the next one.
Gartner's Magic Quadrant shows how far scored axes can go. Its two axes are Ability to Execute, built from criteria such as products and services, overall viability and customer experience, and Completeness of Vision, built from criteria such as market understanding, business model and innovation (Gartner). The four boxes it produces, Leaders, Challengers, Visionaries and Niche Players, are a market map most software buyers have seen.
Whatever goes on an axis, write down the factors that determine each company's score, so two analysts working weeks apart place it in the same spot. A position nobody can reproduce gets argued away in the first meeting, and the analysis behind it goes with it.
Where market map data comes from
Data collection for market mapping is mostly desk research, the subject of secondary market intelligence. The sources sort by how hard their numbers are:
- Company filings and earnings releases: revenue by segment, the firmest numbers available for public companies.
- Industry reports from research firms: market size and market share estimates, often the only share data a market has.
- Investor databases such as PitchBook and S&P Capital IQ Pro: funding, headcount and prebuilt maps.
- Competitor websites and pricing pages: offerings, pricing and positioning claims, each recorded with the date you saw it.
- Customer feedback and reviews: how customers describe the options and what drives their buying behavior, which is what feeds positioning axes.
- Job postings: what competitors are hiring for, a signal of where they're headed next.
Teams that collect information from all six types get the fullest map, and the strategy that comes out of it is only as good as its weakest source. Record a source and a date for every point you plot. The method in data source attribution techniques covers how, and a map whose dots can't be traced goes back to the drawing board the first time someone senior asks where a number came from.
Worked example: cloud infrastructure, share against growth
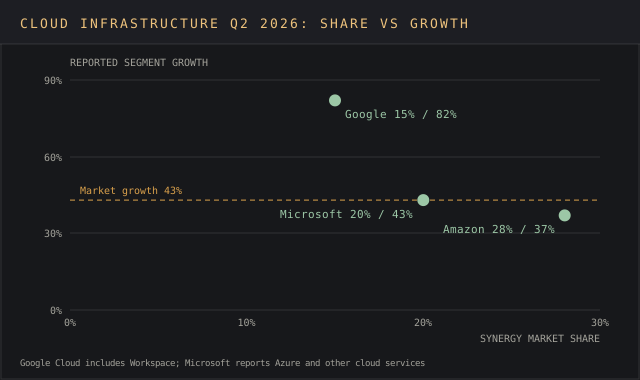
Here's a share-and-growth market map of the world's three largest cloud infrastructure providers, built from public numbers. Synergy Research Group estimates Q2 2026 cloud infrastructure service revenue at $143.4 billion, up 43% year over year, its fastest growth in eight years, with Amazon at 28% market share, Microsoft at 20% and Google at 15% (Synergy Research Group). The three companies report their own growth in their quarterly releases.
| Provider | Q2 2026 share (Synergy) | Reported growth, Q2 2026 | What the growth figure covers |
|---|---|---|---|
| Amazon | 28% | 37% | AWS segment, $42.2 billion (Amazon) |
| Microsoft | 20% | 43% | Azure and other cloud services (Microsoft) |
| 15% | 82% | Google Cloud segment, $24.8 billion (Alphabet) | |
| All other providers | 37% | Not published as a group | Tier-two providers, including Oracle and CoreWeave |
| Whole market | 100% | 43% | Synergy's $143.4 billion quarterly estimate |
Plot share on the horizontal axis and growth on the vertical, and Amazon lands far right and lowest, Google top left, Microsoft between them on the market's 43% line. Synergy's release says Microsoft and Google grow substantially faster than Amazon, so the picture matches the research firm's own insight.
The devil's in the details, though. Each company's growth figure covers its own reporting segment.
Google Cloud includes Workspace, and Microsoft's line reads "Azure and other cloud services," so neither has the same scope as Synergy's infrastructure market. A careful map labels the vertical axis "reported segment growth" and footnotes it, or takes both axes from one research firm. Mixing scopes without a label is how a competitive market map ships with a wrong conclusion baked in.
The remaining 37% belongs to smaller providers. Synergy names Oracle and CoreWeave among those with the highest growth rates, but it publishes no share for them, so on this map they'd sit as one labeled cluster or come off it. That's an honest gap to state on the chart.
Reading the map: crowded corners, empty space and new opportunities
When analyzing a finished map, look for three things. Crowded corners, where five companies cluster, mean fierce competition on one value proposition and similar pricing, and a business launching there usually has to compete on price. Empty space is where no company sits. Outliers are companies that stand alone in a region, which usually means a niche or a deliberate strategy worth a closer look.
Empty space is the part teams get excited about, and it's the part to test hardest. A gap can mean demand with low supply, which is a real opening for product innovation. It can also mean there's no demand, which is why nobody's there.
Before calling a gap one of your new opportunities, check it against demand evidence: search volume, survey answers, deals lost for want of that combination. The white space analysis template walks through that check, and the method in how to size a market puts a figure on what the gap is worth.
Movement over time gives the second insight. Redraw the same map a year apart, and a company drifting toward an empty corner is telling you its next move before it announces it. That's how market mapping lets businesses forecast competitor actions, and how it surfaces potential partners and acquisition targets sitting next to your own position.
The map then feeds marketing strategies, targeting decisions and the wider competitive analysis. Choosing which direct competitors to name in sales material, which crowded corner to position against, and which gap to claim all come out of it. The positioning statement template turns the chosen spot into a sentence, and the market intelligence analysis lesson covers testing the read before it reaches a roadmap.
Adding hiring data, and the recruiter's talent map
Hiring data gives a static map a forward-looking layer. A competitor that starts posting machine-learning roles is describing its next product before the press release does, and open roles by function show where its budget is going. Plot open roles as the size of each dot, and the map shows which competitors are investing as well as which are large. Analyzing hiring this way turns market mapping into an early-warning system.
Recruiters use the same words for a related job. In recruitment, market mapping means listing the talent in a target market before any role opens: the companies that employ the skills you need, the people in those roles, their seniority and their likely pay.
Recruiters build these maps to zero in on candidates early and fill proactive talent pipelines, so a search starts from a shortlist on day one, and the goals they name are a lower cost per hire, a shorter time to fill and better salary benchmarks for clients.
The two versions share data. Companies mapping talent pools also learn competitor hiring practices: which universities competitors recruit from, which skills they pay a premium for and which teams are growing. For a hiring manager, a talent map shows where the people are and how hard they'll be to reach. For an analyst, the same hiring signals show where the competition is heading, so it pays to keep an eye on both in one shared sheet.
Sourcing for a talent map draws on LinkedIn profiles, competitor career pages and recruiters' own past searches. Treat the hiring counts the way you treat any market data: date them, name the source and expect them to change monthly.
Where market maps mislead
Roger Martin, former dean of the University of Toronto's Rotman School of Management, wrote in December 2023 that market maps make him nervous (Roger Martin on Medium). His three warnings hold for every map type in this lesson. The variables on the axes are one selection among many, and once a map is shared, people start treating it as the real shape of the market.
His second warning is that the largest box pulls investment toward it, even though big blocks hide large differences inside them. His third is that a map draws attention to what's drawn, so segments outside it go unseen. He points to Vanguard's index funds and Lego's focus on construction toys as successes that came from outside the map their industries had drawn.
His fixes are practical. Redraw the map with a different pair of axes and see what moves. Break the biggest block into parts before putting money into it. Go looking for customer needs the map can't show. A market map is a prompt for the next question, and teams that treat it as set in stone miss the boat when the market shifts under them.
How often to redraw a market map to stay ahead
Markets move under the map. Brinker's 2025 martech count removed 1,211 solutions that were acquired or shut down and added 2,489 new ones, out of 11,133 candidates evaluated, an 8.6% churn rate on the prior year's 14,106 (chiefmartec). A landscape drawn one spring had roughly one dot in twelve out of date by the next.
A workable cadence for a small team: a positioning map every quarter, a full landscape once a year, and an unscheduled update when one of your main competitors raises a round, launches into your segment or gets acquired. Tie the map to the industry trends checks from the previous lesson, since a trend that passes its tests usually shows up as companies moving on the map soon after.
Software platforms, many with AI that sorts companies into categories, can track competitors and refresh the data.
The site ranks the options in its market positioning tools and competitor analysis tools rankings. Treat any tool's auto-generated map as a first draft to validate, because its categories came from someone else's market definition. The map is one input to a market intelligence strategy, and its date belongs in the chart title so nobody mistakes last year's picture for this year's.
FAQ
What is a market map?
A market map is a visual representation of the companies in one defined market, sorted into categories or plotted on two axes. It shows who competes with whom, where companies cluster and where gaps sit, so a team can see the whole competitive landscape on one page.
How do you create a market positioning map?
Write a one-sentence market definition, list every company in it, pick two axes customers trade off against each other, score each company on both with a written rule, and plot them. Test any empty quadrant against demand evidence before acting on it, then redraw quarterly.
Can you provide an example of a market map?
Scott Brinker's 2025 marketing technology landscape is a landscape map of 15,384 solutions in 49 categories. Gartner's Magic Quadrant is a two-axis positioning map. The real-world cloud example in this lesson is a share-and-growth map built from Synergy Research and company earnings releases.
What is a competitive positioning map?
It's competitor mapping in its narrowest form: a positioning map limited to direct competitors and indirect competitors in one market, plotted on attributes buyers use to choose between them. Sales and product teams use it to pick a position for their products and services, name the competitors to target and identify gaps in the market.
What are the disadvantages of market mapping?
The main challenges: the axes are one choice among many, so a map can look definitive while hiding better variables. Large boxes hide internal differences, gaps can mean no demand, and maps go stale fast: the 2025 martech landscape lost 1,211 tools in a year. Redraw with new axes and test every gap.
What is the difference between market mapping and talent mapping?
In market intelligence, market mapping plots competing companies. In recruitment, market mapping or talent mapping lists the people with the skills a company needs, where they work and what they're paid, so recruiters can build talent pipelines before a role opens.
Is there a free market map template?
Yes. The site's competitive analysis template covers the company list and scoring, and the perceptual map template above holds the two-axis grid. Both are free to download.
Bottom line
Market mapping success depends on three things: the market is defined in writing, the axes are trade-offs customers make, and every dot has a source and a date. With those in place, a market map gives a team one shared picture of who sits where, which gaps are worth testing and which competitors are moving.
Get market mapping wrong and the map does damage with confidence, because a chart looks more certain than the information behind it. A price-against-quality chart, a growth axis mixing reporting scopes, or an empty corner nobody tested can send a roadmap after demand nobody has measured. Martin's warning applies to every version: the map is a prompt, and the questions it raises are the real output.
The next step in Path 3D is to put numbers on the share axis. The market share calculator gives each company's share, its share relative to the leader and the HHI for the whole market, ready to plot.