Product Comparison Template
 By Jan Suski. I go deep on every review, checking every number against its source and digging up details other coverage misses, a habit from six years of SEO and link building for tech companies. Bylines at Brand24 and Senuto. How the scoring works.
Get the product comparison template
An Excel workbook that weights your criteria, scores each product 1 to 5, gates out anything that fails a must-have, and divides three-year cost by score. A Word chart version is included for sharing.
Download XLSX Word chartA product comparison template is a table that lines up two to five products against the same criteria, so a buying decision rests on the same facts for every option. Each row is a criterion, each of the columns is a product, and the cells hold the specs, the price and a score.
This page gives you two free files. The Excel workbook does the scoring: weighted criteria, must-have checks and a three-year cost per product. The comparison chart template in Word is a one-page side-by-side table you can paste into a proposal or send to someone who won't open a spreadsheet. Below you'll find the download, what to include, a step-by-step method, a worked example and the Excel chart question.
It's for anyone making a purchase with more than one decision-maker: operations leads picking software, procurement teams with three quotes on the desk, product managers building a feature comparison for a launch, and small business owners who want a record of why they picked one product over another two.
That record matters long after the purchase. When someone asks six months later why the team chose the tool it's paying for, the workbook shows the facts, the weights and the quotes that picked the winner, all in one place.
Download the free product comparison template
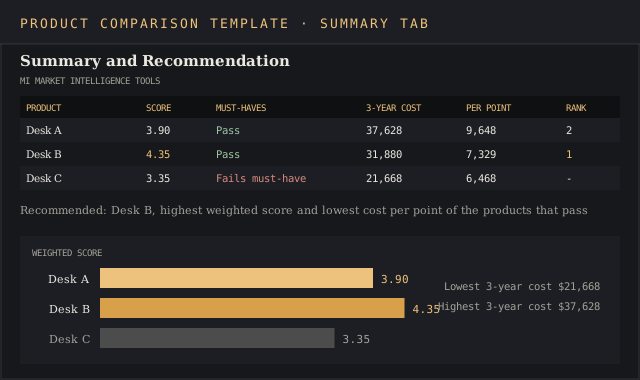
Download the template (XLSX)Five tabs: instructions, criteria and weights, a side-by-side comparison grid, three-year cost, and a summary that ranks the products, pre-filled with the Northwind Outdoor help desk example.
Download the comparison chart (DOCX)A one-page Word comparison chart with eight criteria rows, three product columns, a price row and a recommendation line, for sharing the result.
The workbook opens in Excel, Google Sheets and LibreOffice Calc and runs on SUMPRODUCT, COUNTIFS and RANK, which all three support. The Word file opens in Word, Google Docs and Pages. Enter your own products over the example and the formulas recalculate.
What a product comparison template does
Product decisions often go wrong at the research stage. Someone opens three vendor websites, each one describes its features in its own words, and the team ends up comparing marketing copy. A comparison template forces every product into the same rows, so a missing feature shows up as an empty cell next to two filled ones.
Nielsen Norman Group's guidance on comparison tables by Kate Moran and Taylor Dykes makes the same point from the user's side: inconsistent content is the main failure of most comparison tables, and missing or uneven attribute data can make a table useless. Their advice is to keep comparisons to five items or fewer. The template has columns for three products, with room to add two more.
A good template does three jobs at once:
- Lays out specifications side by side, with the same unit and wording in every cell.
- Scores each product against weighted criteria, so a long feature list can't outvote one missing must-have.
- Compares cost over the full term, so a cheap monthly price with a large setup fee shows its real number.
A plain feature comparison template stops at the first job. That's fine for a website table that helps users see differences. For a purchase with a budget attached, the team needs the scoring and cost tabs to analyze the options and make the call.
What's inside the template
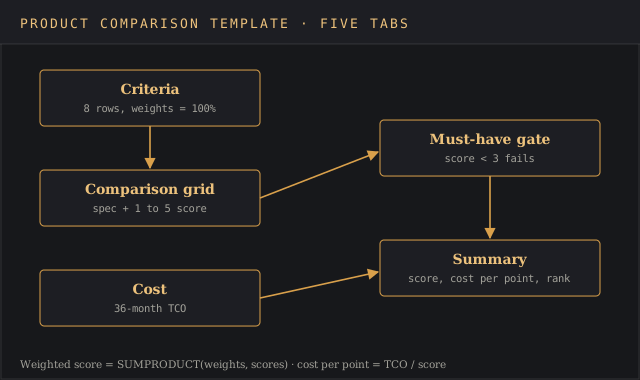
The Excel file has five tabs, filled in left to right. The Word file is a single table that you fill in once the Excel summary has a winner.
| Tab | What you enter | What it calculates |
|---|---|---|
| Instructions | Nothing | The order to fill in the tabs and the scoring scale |
| Criteria | Group, criterion, must-have flag, weight | Total weight, which must read 100% |
| Comparison | The spec or observation for each product, and a 1 to 5 score | Weighted points per criterion |
| Cost | Price per seat or unit, quantity, months, add-ons, one-time fees | Total cost of ownership per product |
| Summary | Nothing | Weighted score, must-have pass, cost per point, rank, recommendation |
What to compare: criteria, weights and must-haves
Start by writing the evaluation goal in one sentence at the top of the Criteria tab, so the purpose sits in one place: what you're buying, for whom, and what problem it has to solve. "A help desk for 12 agents that shows Shopify order data inside each ticket" hands you two criteria before you've listed any.
Group the criteria into a few logical buckets so the table is easy to scan. Four groups cover most products:
- Functional fit: the features the product must offer to do the job.
- Usability: how fast the people who use it daily can work in it, ideally scored from a trial.
- Integration and technical fit: APIs, data export, compatibility with what you already run.
- Vendor and commercial terms: support hours, contract length, cancellation terms.
- Reputation: customer review ratings and expert opinions, with the review site and date in the notes column.
Rename the groups and rows to fit your product category. A laptop comparison swaps the help desk rows for battery life, weight, ports and warranty, and a supplier comparison adds lead time and minimum order quantity. The weights, scores and formulas work the same way for any rows you enter.
Mark the must-haves separately. Charles Kepner and Benjamin Tregoe built the split between "musts" and "wants" into their 1965 book The Rational Manager, summarized in this checklist on their model, and the split still stops a product with great extras from winning while it fails a requirement. In the template, a must-have scored below 3 fails the product on the Summary tab, whatever its total.
Then set weights that add up to 100%. Products that require a long setup or a specialist admin should lose points under usability, so name those factors now.
The grid mixes quantitative measures, like seat prices, trial ratings and response-time SLAs, with qualitative ones, like contract terms, and the 1 to 5 scale puts both on the same footing. Weighting forces the argument about priorities to happen before anyone sees the scores, which takes some bias out of the result. If the team is split on ease of use at 10% or 20%, settle it in this step, because changing weights after scoring is how a favorite gets rescued.
How to fill in the product comparison template
The tabs run left to right as one workflow, from setup to comparison to a decision. Seven steps:
- Select three to five products. Use search, our software rankings or analyst reviews to build a long list, then cut it to the options that pass your must-haves on paper. Add a column only if it's needed.
- Enter the criteria and weights. Six to ten criteria is plenty. Check that the total weight cell reads 100%.
- Fill the comparison grid with facts. Type the actual spec in each cell, like "Email, chat, Instagram, WhatsApp", with the source and date in the notes column. Avoid "yes" where a number or a list is available.
- Score each cell from 1 to 5. Use the scale on the Instructions tab, the same way for every product. Score from a trial or demo wherever you can.
- Build the cost tab. Enter list price, quantity, term and every one-time fee from the written quote.
- Read the Summary tab. Check must-haves first, then weighted score, then cost per point.
- Write the recommendation. One sentence naming the product and the two reasons. Copy it to the Word chart for the people who only need the answer.
Keep a log of what changed while you're making the decision. If a vendor revises its quote or a trial changes a score, note the date on the Comparison tab, so anyone who reviews the decision later can see why the numbers moved.
Worked example: choosing a help desk for a 12-agent support team
Northwind Outdoor is an online retailer with 12 support agents. It's replacing a shared inbox with help desk software and has three products on the shortlist, called Desk A, Desk B and Desk C here. The prices below are this scenario's quotes and stand in for whatever your vendors send. The same numbers are pre-filled in the download.
Northwind's team sets eight criteria. Two are must-haves: one inbox for email, chat and social messages, and Shopify order data shown inside each ticket.
| Criterion | Must-have | Weight | Desk A | Desk B | Desk C |
|---|---|---|---|---|---|
| Email, chat and social in one inbox | Yes | 20% | 5 | 4 | 3 |
| Shopify order data in tickets | Yes | 15% | 5 | 5 | 2 |
| Automation rules and macros | No | 10% | 4 | 5 | 3 |
| Agent ease of use (trial) | No | 20% | 3 | 5 | 4 |
| API and webhooks | No | 5% | 5 | 4 | 3 |
| Reporting (CSAT, first response time) | No | 10% | 4 | 3 | 3 |
| Vendor support hours and SLA | No | 10% | 3 | 4 | 4 |
| Contract terms | No | 10% | 2 | 4 | 5 |
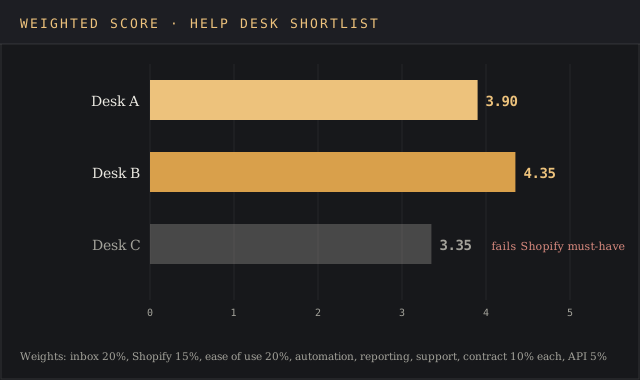
| Weighted score | 100% | 3.90 | 4.35 | 3.35 |
The weighted score is SUMPRODUCT of the weights and the scores. For Desk B that's 0.20 × 4 + 0.15 × 5 + 0.10 × 5 + 0.20 × 5 + 0.05 × 4 + 0.10 × 3 + 0.10 × 4 + 0.10 × 4, which comes to 4.35.
Desk C scores 2 on Shopify order data because it needs a manual lookup in a separate tab. That fails a must-have, so the Summary tab marks Desk C "Fails must-have" and leaves it out of the ranking. Without the gate, Desk C would still sit third on score. On cost, though, it would look like the best value.
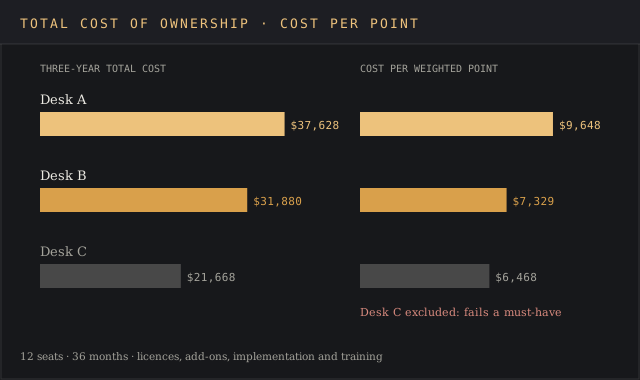
The Cost tab runs each product over a 36-month term for 12 seats:
| Cost line | Desk A | Desk B | Desk C |
|---|---|---|---|
| Price per seat per month | $79 | $65 | $49 |
| Seats × months | 12 × 36 | 12 × 36 | 12 × 36 |
| Licences over the term | $34,128 | $28,080 | $21,168 |
| Add-ons per month | $0 | $50 | $0 |
| Add-ons over the term | $0 | $1,800 | $0 |
| Implementation (one-time) | $2,500 | $1,500 | $0 |
| Training (one-time) | $1,000 | $500 | $500 |
| Three-year total cost | $37,628 | $31,880 | $21,668 |
| Cost per weighted point | $9,648 | $7,329 | $6,468 |
Below the ranking, the Summary tab shows the lowest and highest three-year quote, $21,668 and $37,628, so the spread between vendors is visible before anyone negotiates. Desk B wins on both counts that matter. It has the highest weighted score at 4.35, and among the products that pass the must-haves, the lowest cost per weighted point at $7,329. Desk A costs $5,748 more over three years and scores 0.45 lower, mostly on agent ease of use and contract terms.
The recommendation line on the Summary tab reads: "Desk B: highest weighted score (4.35) and lowest cost per point of the products that pass both must-haves." That sentence goes into the Word chart, together with the eight rows and the three totals, and the support lead sends it to the finance director for sign-off.
Download the comparison chart (DOCX)
Price versus total cost of ownership
The price on a vendor's pricing page is one row of the cost tab. Total cost of ownership adds the recurring fees, add-ons, implementation, training, and any cost to leave at the end. Gartner popularized TCO analysis for IT purchases in 1987, according to the TCO entry on Wikipedia, and the idea applies to any product with a contract.
In the worked example, Desk A's seat price is $14 more than Desk B's per month. Over 12 seats and 36 months that gap becomes $6,048 in licences alone, before setup fees. The cost tab makes that multiplication automatic, so a small difference in the price column can't hide a large one in the total.
Cost per weighted point puts score and cost in one number. Divide each product's total cost by its weighted score and the lowest result is the best value per unit of fit. Use it as a tie-breaker between products that pass every must-have and sit close on score.
How to create a comparison chart in Excel
The Summary tab already has a bar chart of weighted scores. To build your own comparison chart in Excel from any table on the workbook:
- Select the product names and the values you want to plot, headers included.
- Open the Insert tab and choose Recommended Charts, or Insert Column or Bar Chart for a clustered column chart.
- Pick a clustered bar for scores and a clustered column for cost lines across products.
- Add a chart title and data labels, and remove the gridlines you don't need.
Microsoft's guide covers the same steps for every chart type. In Google Sheets the route is Insert, then Chart, and the chart editor suggests a column chart for a table like this one. Charts show users the size of the gap between products at a glance, and they flag opportunities to negotiate when one vendor's cost bar towers over the others. Keep the table next to the chart so readers can still see the exact values.
Common mistakes in product comparisons
- Comparing too many products. Ten columns turn a decision into research. NN/g's advice of five or fewer applies to internal comparisons too.
- Copying vendor descriptions. Vendors offer feature descriptions written to sell. Rewrite each cell in your own words and the same units, or the table rewards the vendor with the best copywriter.
- Scoring before weighting. Set weights first, or the weights will drift toward the product someone already likes.
- Treating price as a criterion. Scoring price 1 to 5 and also counting cost double-counts it. Keep cost on its own tab and combine it at the end.
- Skipping the must-have gate. A product that fails a requirement can still post a decent average, which is how teams buy software that can't do the main job.
Word, Excel or Google Sheets
Use Excel or Google Sheets for the scoring, because the weights, SUMPRODUCT and cost math need live formulas. Use the comparison chart template Word file when the output is a document: a one-page summary for an approver, a section of a proposal, or a printed handout for a meeting. The Word file has no formulas, so fill it in from the finished Excel summary.
A table on a website is a third format. If you're building a public product comparison chart for users to compare plans, the same rules apply: consistent rows, the same units, and a way to highlight the differences. NN/g points to Best Buy's "highlight differences" switch as a good example of the last one.
Affiliate and review sites build these tables inside WordPress. Spencer Haws of Niche Pursuits describes two routes: TablePress, a free plugin where you enter the table by hand or upload a CSV, and AmaLinks Pro, his company's plugin, which pulls product images, prices and Prime eligibility from the Amazon API.
Haws recommends price and star ratings in almost every chart, notes that Amazon's agreement allows prices only when they come from the API, and credits comparison tables with higher conversion rates on his own sites.
For vendor selection with formal bids, the bid comparison template adds supplier-specific fields like delivery dates and payment terms. For a scoring matrix with no cost tab, the decision matrix template is lighter. Software buyers can also run the shortlist through the vendor evaluation scorecard after the comparison narrows it to two.
FAQ
How do you create a comparison matrix?
List the options across the top and the criteria down the side, give each criterion a weight that adds up to 100%, score every option from 1 to 5 on each criterion, and multiply scores by weights to get a total per option. The Excel template above does the math with SUMPRODUCT.
What is a good template for a product review?
A good product review template has the same fixed sections for every product: what it does, who it's for, the specs, the price, pros and cons, and a score against stated criteria. The comparison grid in this workbook works as the scoring part of a review.
How do I create a comparison chart in Excel?
Select the product names and values with their headers, go to Insert, and choose a clustered column or bar chart. Add data labels and a title, and keep the source table next to the chart. The template's Summary tab includes a ready-made bar chart of weighted scores.
What is the best diagram for compare and contrast?
For two or three items with shared and unique features, a Venn diagram shows the overlap at a glance. For products with many attributes, a comparison table or matrix works better, because each attribute gets its own row and each product its own column.
How many products should a comparison include?
Three to five. NN/g recommends five or fewer for comparison tables, and the must-have check in this template trims the list further.
Bottom line
Use the product comparison template when two or more people need to agree on a purchase and the options differ on features and price. The Excel file gives you weighted scores, a must-have gate and a three-year cost per product, and the Word comparison chart gives you a one-page result to share.
For comparing your own product with competitors, the competitive analysis template fits better. When you still have to decide if the purchase is worth making, start with a cost-benefit analysis and come back to this file once the answer is yes.