Cost Benefit Analysis Template
 By Jan Suski. I go deep on every review, checking every number against its source and digging up details other coverage misses, a habit from six years of SEO and link building for tech companies. Bylines at Brand24 and Senuto. How the scoring works.
Get the cost benefit analysis template
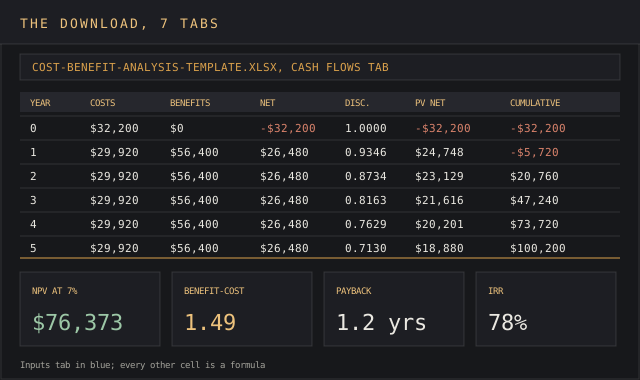
An Excel workbook that turns one set of input assumptions into a five-year cash flow, net present value, benefit-cost ratio and break-even point, with a sensitivity table and a scenario table that recalculate when you change a single cell.
Download XLSXA cost benefit analysis template is a spreadsheet that lists every cost and every benefit of a decision, puts each one in monetary terms year by year, and reduces the lot to three numbers: net present value, the benefit-cost ratio and the break-even point. If benefits beat costs after discounting, the project goes ahead and the business owner has a number to defend. If they don't, the template shows which assumption would have to change.
This article covers the free XLSX download, what each tab holds, the cost and benefit categories to fill in, the formulas behind the key metrics, an eight-step method, and a worked example: a 40-van delivery business deciding on route-planning software, with a sensitivity test that finds the one assumption the whole decision hangs on.
It's for the people who have to defend a spending decision with numbers: a business owner weighing a new project, an operations manager comparing two vendors, a finance analyst asked to check a department's business case before the budget review.
The method is older than any spreadsheet. French engineer Jules Dupuit proposed it in 1844, and it wasn't applied at scale until the U.S. Flood Control Act of 1936 required flood-control benefits to exceed costs, per Britannica. The Act's text funds projects only "if the benefits to whomsoever they may accrue are in excess of the estimated costs" (49 Stat. 1570), and the test in this template is the same one.
Download the free cost benefit analysis template
Download the cost benefit analysis template (XLSX)Seven tabs hold inputs, a five-year cash flow, a summary with NPV, benefit-cost ratio, payback and IRR, a sensitivity table, a scenario table, an intangible benefits log and a how-to sheet, all pre-filled with the route-planning worked example.
The file opens in Excel, Google Sheets and LibreOffice Calc. Every input sits on one tab in blue, and every other cell is a formula, so changing the discount rate or a cost estimate updates the cash flows, the summary and both sensitivity tables at once.
Cost benefit analysis definition
A cost benefit analysis catalogues the impacts of a decision as costs and benefits, values them in money, and compares the result with doing nothing, using either net benefits (benefits minus costs) or the benefit-cost ratio (benefits divided by costs). That's the definition Jiang and Marggraf use in their 2021 history of the method in Cost Effectiveness and Resource Allocation.
Companies use the method to determine which of several options to fund and to make informed decisions on evidence a reviewer can check. The comparison with doing nothing is the part people skip. A cost benefit analysis measures the change a decision causes, so the baseline equals the business's spending and income if it keeps running unchanged.
Three neighbouring tools answer different questions. A return-on-investment figure divides profit by investment, a quick read on profitability that ignores when the money arrives.
The risk-benefit analysis template scores the odds and severity of harms against the upside, which suits safety and compliance decisions where the downside is an event and has no price tag. A feasibility analysis checks that the project can be built and run with the money, people and time available.
What goes into the cost benefit analysis template
The workbook has seven tabs. Inputs feed everything else, so a reviewer can audit the whole analysis by reading one tab.
| Tab | What it holds | What you change |
|---|---|---|
| Inputs | Discount rate, time horizon, every cost and benefit driver, each with a source note | All blue cells |
| Cash Flows | Direct costs, indirect costs, total costs, each benefit line, net cash flow, discount factor, present values and cumulative net for years 0 to 5 | Nothing, all formulas |
| Summary | NPV, PV of benefits, PV of costs, benefit-cost ratio, payback in years, IRR and a one-line verdict | Nothing, all formulas |
| Sensitivity | NPV recalculated across a range of values for the biggest benefit driver and for the discount rate | The range of test values |
| Scenarios | Pessimistic, base and optimistic cases side by side, with NPV and benefit-cost ratio for each | The scenario values |
| Intangibles | Benefits you can't price credibly, with who gains, the evidence and a 1 to 5 score | Every row |
| How to use | The eight steps below, condensed to one line each | Nothing |
Cost categories to list
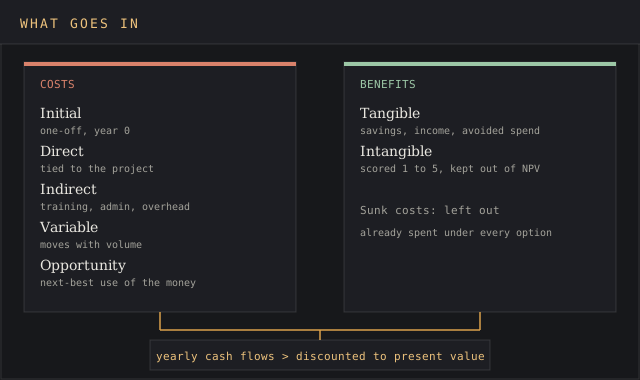
List all the costs across the entire lifecycle of the project, from purchase to the last year of the horizon, including potential costs that only show up if the project scales. The categories below cover most business decisions, and the Inputs tab has a row for each.
- Initial costs. One-off spending in year 0, such as purchase price, implementation, setup, hardware, raw materials for a first production run.
- Direct costs. Spending tied to the project itself, such as subscription fees, equipment leases and the labor costs of the people doing the work.
- Indirect costs. Spending the project causes elsewhere, such as training hours, admin time, extra support load, a share of overhead.
- Variable costs. Costs that move with volume, like a per-seat licence or per-unit materials, which matter when the project scales a product line.
- Opportunity cost. What the money or the team would earn on the next-best use. The discount rate covers the money side, and the Intangibles tab can record the team-time side.
Project management teams often keep project costs in a separate tracker, so pull those figures into the Inputs tab and note where they came from. Leave sunk costs out. Money already spent can't be recovered by either choice, so it doesn't belong in a forward-looking analysis.
Benefit categories to list
Tangible benefits have a price. Cost savings, extra income from new sales and avoided expenses, such as a vehicle the business no longer needs to buy, all qualify. Each goes on its own line in the cash flow so a reviewer can challenge one without reworking the others.
Intangible benefits are real and harder to price: staff morale, customer satisfaction, brand reputation, lower compliance exposure. The template gives them their own tab with a score, because a made-up monetary value buried in a total can flip the verdict without anyone reviewing the total seeing it.
Key metrics for NPV, benefit-cost ratio and break even point
Three outputs carry the decision, and each answers a different question about the same cash flows. Analyzing all three together guards against a project that looks good on one and poor on the others.
| Metric | Formula | Decision rule |
|---|---|---|
| Net present value (NPV) | Sum of each year's net cash flow ÷ (1 + discount rate)year | Above zero, benefits exceed costs at present value |
| Benefit-cost ratio (BCR) | PV of total benefits ÷ PV of total costs | Above 1.0, each dollar spent returns over $1 |
| Break even point (payback) | The year cumulative net cash flow turns positive | Shorter is safer when estimates are uncertain |
| IRR | The discount rate at which NPV equals zero | Above your hurdle rate |
To calculate net present value in Excel, use =NPV(rate, year1:year5) + year0. Microsoft's NPV function documentation says the values must occur at the end of each period, and that a first value at the start of the first period gets added to the NPV result outside the values arguments. Put the initial investment inside the brackets and Excel discounts it a full year it was never waiting.
Choosing a discount rate
The discount rate converts future cash flows to present value and prices the time value of money. A business usually uses its cost of capital or the return it demands from any new investment, and a higher rate favours projects that pay back early.
For a public reference point, the U.S. Office of Management and Budget's Circular A-94 sets a 7% real base-case rate. OMB revoked the 2023 revision of the Circular and reinstated the 1992 version in April 2025 with memo M-25-23, and the 7% figure dates to that 1992 version, per a review of federal discounting published by Cambridge University Press. The worked example uses 7% and the Sensitivity tab tests 3% to 12%.
How to do a cost benefit analysis in 8 steps
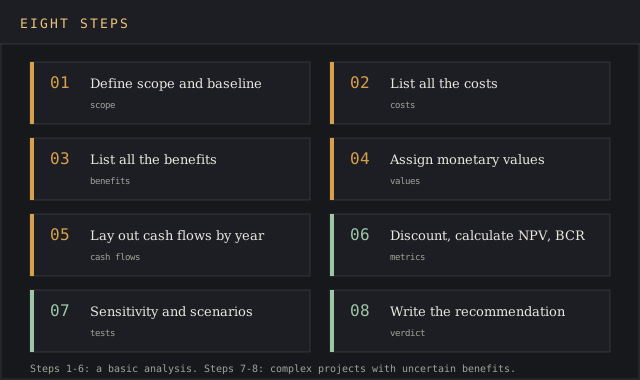
The method breaks into eight manageable steps. The first step decides what counts, and most disputes about a finished cost benefit analysis trace back to it. The key steps after that are mechanical once the estimates are in.
- Define the scope and the baseline. Name the decision, the alternatives, the time horizon and what happens if the business does nothing. Include the competition's likely moves if the decision affects pricing or demand.
- List all the costs. Work through initial, direct, indirect and variable costs for every year of the horizon. Leave no stone unturned on labor, since training and admin hours are the costs proposals most often drop.
- List all the benefits. Split tangible from intangible. Write each benefit as a measurable change, such as litres of fuel, hours of overtime or orders per week.
- Assign a monetary value to each line. Use historical data, vendor quotes and payroll figures to determine each figure in monetary terms. Note the source of every estimate in the Inputs tab.
- Lay out the cash flows by year. Put one-off spending in year 0 and recurring items in years 1 onward.
- Discount and calculate the key metrics. NPV, benefit-cost ratio, payback and IRR, all on the Summary tab.
- Run sensitivity and scenario analysis. Change one assumption at a time to discover the critical variables and the potential risks behind them, then build pessimistic and optimistic cases from them.
- Write the recommendation. One paragraph with the verdict, the NPV range across scenarios and the assumption the decision depends on most.
A basic analysis for a small purchase can stop after step 6, and a simple analysis of a one-year subscription can skip discounting. Complex projects with uncertain benefits need steps 7 and 8, because a single NPV figure hides how much of it rests on one estimate.
Worked example with route-planning software for a 40-van fleet
Say a regional delivery business runs 40 vans, spends $480,000 a year on fuel and $120,000 on driver overtime, and is weighing route-planning software. The vendor's pitch promises shorter routes. The operations manager has to show the business owner the money before anyone signs, and the cost benefit analysis template is the format the owner asked for.
Inputs
| Input | Value | Type |
|---|---|---|
| Implementation and setup (vendor quote) | $18,000 in year 0 | Initial, direct |
| Driver tablets, 40 × $250 | $10,000 in year 0 | Initial, direct |
| Training, 120 hours × $35 | $4,200 in year 0 | Initial, indirect |
| Subscription, 40 vans × $45 per month | $21,600 a year | Recurring, direct |
| Dispatcher admin, 4 hours a week × $40 | $8,320 a year | Recurring, indirect |
| Fuel saving, 8% of $480,000 | $38,400 a year | Tangible benefit |
| Overtime saving, 15% of $120,000 | $18,000 a year | Tangible benefit |
| Discount rate and horizon | 7%, 5 years | Assumption |
The 8% and 15% savings are the operations manager's own estimates from a two-week pilot on six vans. They're assumptions to test, and the sensitivity tab exists for exactly this kind of figure.
Cash flows and results
| Year | Total costs | Total benefits | Net cash flow | Cumulative net |
|---|---|---|---|---|
| 0 | $32,200 | $0 | −$32,200 | −$32,200 |
| 1 | $29,920 | $56,400 | $26,480 | −$5,720 |
| 2 | $29,920 | $56,400 | $26,480 | $20,760 |
| 3 | $29,920 | $56,400 | $26,480 | $47,240 |
| 4 | $29,920 | $56,400 | $26,480 | $73,720 |
| 5 | $29,920 | $56,400 | $26,480 | $100,200 |
Discounted at 7%, the total benefits over five years are worth $231,251 today and the costs $154,878. That gives a net present value of $76,373 and a benefit-cost ratio of 1.49. Cumulative net cash turns positive 1.2 years in, around month 15, which is the break even point, and the IRR is 78%. The initial investment of $32,200 pays back well inside the five-year horizon.
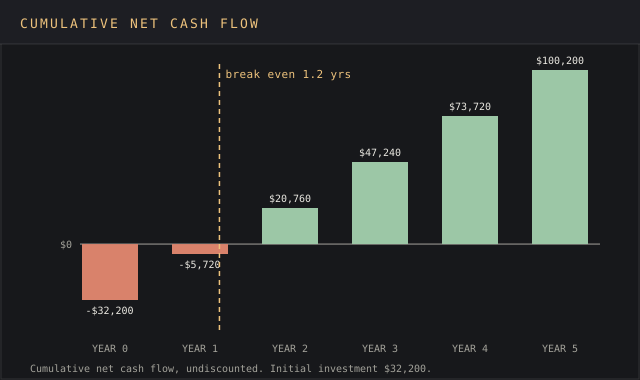
On those numbers the project goes ahead. Don't count your chickens before they hatch, though: the fuel saving carries 68% of the yearly benefits, and it rests on six vans over two weeks.
Sensitivity analysis
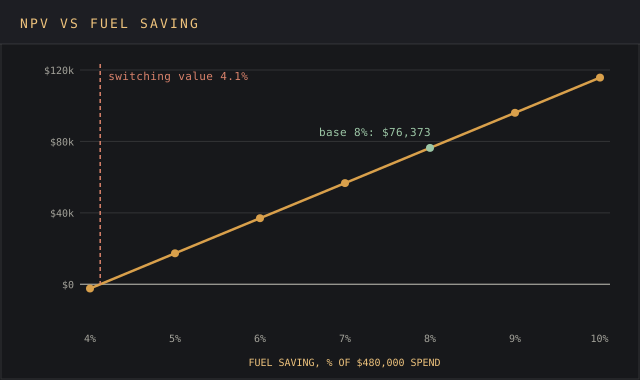
The Sensitivity tab recalculates NPV for fuel savings from 4% to 10%, holding everything else at the base case. Fuel prices swing with market conditions, which is one more reason to test the estimate.
| Fuel saving | NPV at 7% |
|---|---|
| 4% | −$2,351 |
| 5% | $17,330 |
| 6% | $37,011 |
| 8% (base) | $76,373 |
| 10% | $115,735 |
NPV crosses zero at a fuel saving of 4.1%. That's the switching value. The business owner has to believe the software saves at least 4.1% of fuel spend for the purchase to pay, and the pilot measured 8%. A switching value close to the base estimate would be a red flag, and here the gap is 3.9 points. Next to the fuel figure, the discount rate is a drop in the bucket. NPV stays at $89,071 at 3%, $68,180 at 10% and $63,254 at 12%.
Scenario analysis
Scenarios move several assumptions together, since one cause, such as a slow rollout or a shift in market conditions, cuts fuel and overtime savings at the same time. Future scenarios built this way show the range of outcomes a single NPV hides. For the external forces behind each case, the scenario planning template builds four futures from two critical uncertainties.
| Scenario | Fuel saving | Overtime saving | NPV | Benefit-cost ratio |
|---|---|---|---|---|
| Pessimistic | 5% | 10% | −$7,271 | 0.95 |
| Base | 8% | 15% | $76,373 | 1.49 |
| Optimistic | 10% | 20% | $140,336 | 1.91 |
The pessimistic case loses $7,271 at present value. The recommendation the operations manager writes follows from that: sign a 12-month contract, measure fuel per stop monthly, and cut your losses at renewal if the fleet-wide saving sits under 4.1%. In the long run, the monthly measurement replaces the pilot estimate with a year of fleet-wide data.
Intangible benefits
Two intangible benefits stayed off the cash flow. Drivers finish closer to scheduled time, and customers get tighter delivery windows. One approach to pricing them is a proxy, such as the cost of a lost customer, but neither had data behind it here.
The Intangibles tab scores them 3 and 4 out of 5, with the evidence noted: pilot drivers' feedback and the share of pilot deliveries inside a one-hour window. They can tip a close call, and the template keeps them out of the NPV so they can't turn a loss into a gain on paper.
Common cost benefit analysis mistakes
The devil's in the details. These seven errors in cost benefit analysis account for most analyses that get sent back to the drawing board at budget review.
- Year 0 inside Excel's NPV(). The function discounts every value a full period, so the initial investment shrinks by the discount rate and NPV comes out too high.
- Sunk costs in the totals. Last year's failed pilot can't be recovered by any option the analysis compares, so it stays out.
- Labor left off the cost side. Training hours and admin time are indirect costs, and in the worked example they add $4,200 up front and $8,320 a year.
- Double-counted benefits. Fewer overtime hours and "higher driver productivity" can be the same saving written twice.
- Nominal cash flows with a real discount rate. Pick one basis. If the cash flows include inflation, the discount rate must too.
- A horizon shorter than the asset's life. Five years of costs against three years of benefits makes most projects look bad, and the reverse makes them look good.
- Pie-in-the-sky intangibles. A brand-value figure nobody can source turns a negative NPV positive on paper. Score it on the Intangibles tab and leave the cash flow alone.
Before the analysis goes to the decision-maker, ask someone outside the project to play devil's advocate on the three largest benefit lines and the key assumptions behind them.
Cost benefit analysis template for Excel, Word or Google Sheets
Excel and Google Sheets are the right format for the numbers, because discounting, sensitivity tables and scenarios are formula work. The file on this page uses NPV, IRR, SUM and plain arithmetic, all of which behave the same in both.
Word suits the write-up that travels with the numbers. Paste the Summary tab and the scenario table into a one-page memo with the recommendation paragraph on top, and keep the workbook as the appendix a reviewer can open. A slide deck needs two slides, one for the verdict and NPV range and one for the sensitivity chart.
For financial analysis and budget planning across a portfolio of projects or a model that links into the company's budget and project cost management system, a dedicated planning tool takes over. For a single decision with up to a dozen cost and benefit lines, a spreadsheet does the job in an afternoon. Review the inputs once a quarter and compare the estimates with what the business paid.
FAQ
How do you do a cost benefit analysis?
Define the decision and the do-nothing baseline, list all the costs and benefits for each year, put each in monetary terms, discount the yearly net cash flows to present value, and compare the totals with NPV and the benefit-cost ratio. Then test the biggest assumptions with a sensitivity analysis before deciding.
What is a CBA template?
A CBA template is a pre-built spreadsheet with rows for cost and benefit categories, a year-by-year cash flow, and formulas for net present value, benefit-cost ratio and payback, so the analyst only enters the estimates.
What is the format for a cost benefit analysis?
Inputs and assumptions first, then a cash flow table with one column per year, then the summary metrics, then sensitivity and scenario tables, then a short written recommendation. The first six tabs of the template follow that order.
What is a cost-benefit ratio?
The present value of total benefits divided by the present value of total costs. A ratio above 1.0 means benefits exceed costs. The worked example on this page comes out at 1.49.
How do you calculate the cost-benefit ratio in Excel?
Calculate the present value of benefits and costs separately, for example =NPV(7%, B2:B6)+B1 for each row of totals, then divide the benefits figure by the costs figure. The Summary tab of the template does this in one cell.
What are the 7 types of cost?
Lists vary by textbook. The seven that come up most in a cost benefit analysis are direct, indirect, fixed, variable, initial (one-off), opportunity and sunk costs, and only sunk costs stay out of the analysis.
How is cost-benefit analysis used?
Businesses and companies use it to decide on purchases, hires, new projects and product line changes, and to discover which option pays back first. Governments use it to appraise infrastructure and regulation, and U.S. federal agencies follow OMB Circular A-94 for the method and discount rates.
Bottom line
Use the cost benefit analysis template when a business decision has costs and benefits you can price over several years and someone has to sign off the spend. NPV gives the size of the gain, the benefit-cost ratio gives the return per dollar, and the switching value from the Sensitivity tab gives the assumption the verdict depends on.
When the downside is a harm with a probability and no clean price, the risk-benefit analysis template fits better. If nobody has checked that the project can be built at all, start with the feasibility analysis template, and once the decision is made, the action plan template turns it into dated, owned steps.