Decision Matrix Template
 By Jan Suski. I go deep on every review, checking every number against its source and digging up details other coverage misses, a habit from six years of SEO and link building for tech companies. Bylines at Brand24 and Senuto. How the scoring works.
Get the decision matrix template
An Excel workbook that scores up to six options against up to eight weighted criteria, totals the weighted scores live, and reruns the ranking under a second set of weights.
Download XLSXA decision matrix is a grid that scores each option against the same weighted criteria and adds the results into one number per option. The American Society for Quality files it among its quality tools and lists nine other names for the same grid, including Pugh matrix, decision grid, selection matrix and criteria rating form.
The decision matrix template on this page is a weighted decision matrix built in Excel. You type the criteria, a weight for each and a 1-to-5 score in every cell, and the workbook does the multiplication, the totals and the ranking. This page covers the download, the four tabs, a step-by-step fill-in, a worked example with real values, the Pugh variant, the mistakes that skew results, and the Excel or Google Sheets question.
It's for anyone deciding between three and six alternatives with more than one thing at stake: a product marketing manager who has to compare competitive intelligence platforms, a project management office ranking projects for next quarter's budget, an operations lead choosing a freight carrier.
In most decision making processes, complex decisions get argued one criterion at a time, and the loudest criterion wins the meeting. Writing the weights down before anyone scores puts the trade-offs on paper and gets every reviewer on the same page before the first number goes in.
Download the free decision matrix template
Download the decision matrix template (XLSX)Four tabs with instructions, a weighted matrix with live totals and ranks, a sensitivity tab that reruns the ranking under a second weight set, and a Pugh comparison sheet, pre-filled with the Northvale Analytics worked example.
The free template opens in Excel, Google Sheets and LibreOffice Calc. Totals use SUMPRODUCT and ranks use RANK, two functions all three apps support, so the formulas survive an import intact.
What a decision matrix is
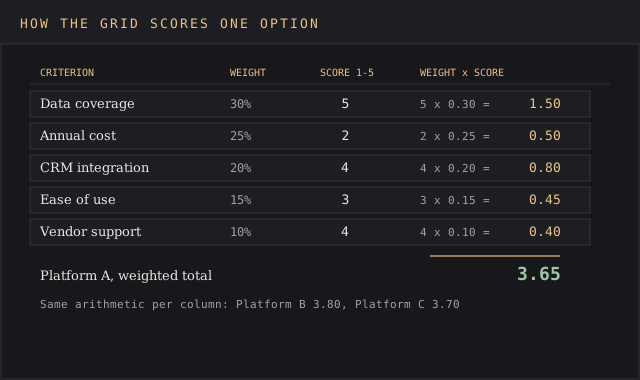
Criteria run down one edge of the decision matrix and the alternatives you want to evaluate run across the other. Each criterion carries a weight that sets its importance, and each option gets a score per criterion. Multiply each score by its weight to get the weighted scores, add them down the column, and the resulting figure is that option's total.
That's a weighted decision matrix, or weighted scoring model, in its plainest form, and it matches the evaluation procedure ASQ publishes: rate every option, multiply each rating by the criterion's weight, then total the points. ASQ treats the top total as the start of the team's decision making process and tells members who rate a cell differently to talk it through until they reach consensus.
The method is older than the spreadsheet. Charles Kepner and Benjamin Tregoe studied managerial decision making while at the RAND Corporation in the 1950s, started their partnership in 1958 and published The Rational Manager in 1965, according to the Kepner-Tregoe company timeline. Weighted criteria sit at the center of the decision analysis process they taught.
When a decision matrix fits
Reach for a decision matrix when several factors influence one decision and the people deciding weigh those factors differently. It works for business and personal choices alike:
- Vendor selection. Three shortlisted platforms, five criteria, one budget line. When the purchase needs a three-year cost per option, the product comparison template adds a cost tab and must-have checks.
- Project prioritization. A project management office deciding which projects get funded and where to allocate resources next quarter. When most of a long backlog will get done in some order, the prioritization matrix template adds rank, quadrant and a capacity line.
- Solution selection. Three candidate solutions to one recurring performance problem.
- Problem selection. A team choosing which of various options to fix first, the case ASQ's own restaurant example covers.
- Hiring and job offers. Candidates scored against role criteria, or one person's offers compared on salary, commute and growth.
- Personal purchases. A car scored on price, running cost, safety rating and cargo space.
- Task triage. A team that needs to prioritize tasks with different payoffs and effort.
It fits poorly when one criterion outweighs everything else. If the budget cap rules out four of five options, a pass/fail check settles the decision in a minute and the scoring adds nothing.
What's inside the template
The decision matrix template has four tabs. Only three take input, and every formula cell is shaded gray and locked so it can't be typed over by accident.
| Tab | What it holds | What you type |
|---|---|---|
| Instructions | The six steps below, the 1 to 5 scale definitions, the color key | Nothing |
| Weighted Matrix | Must-have gate, up to 8 criteria with weights, 1 to 5 scores for up to 6 options, weighted totals, rank, gap to the leader, an evidence column | Options, criteria, weights, scores, evidence |
| Sensitivity | A second weight set, recomputed totals and ranks, a flag on any option whose rank changed | Alternative weights |
| Pugh Matrix | A datum option, +1/0/−1 marks per criterion, counts of pluses and minuses, net score | Datum choice, marks |
How to fill in the decision matrix, step by step
- Identify the alternatives. Two to six fit the grid. Run each through the must-have gate first, a row of yes/no checks where any "No" drops the option before it's scored.
- Define the criteria, the factors that decide the choice. Word each one so a higher score is better: "ease of setup" scores the right way round, "setup difficulty" doesn't. ASQ gives the same advice. Keep the list to relevant criteria, five to eight of them.
- Assign weights before scoring. Split 100% across the criteria to reflect each one's importance. The total cell turns red until the weights add up to 100%.
- Evaluate every cell from 1 to 5 against the written scale: 1 fails the need, 3 meets it, 5 exceeds it. Keep the scale consistent across reviewers, and log the data behind each score (quotes, trial results, reference-call insights) in the evidence column.
- Read the total scores and the gap. The decision matrix template ranks the options and shows each one's gap to the leader. Any gap under 0.15 points is marked as a tie.
- Run the sensitivity tab. Shift weight between the two heaviest criteria to determine if the rank holds. If it flips, that weight is the real decision.
Order matters in this decision making process. Weights set after the scores are in tend to drift toward the option someone already liked, and that lets bias into a tool built to keep it out.
Worked example: choosing a competitive intelligence platform
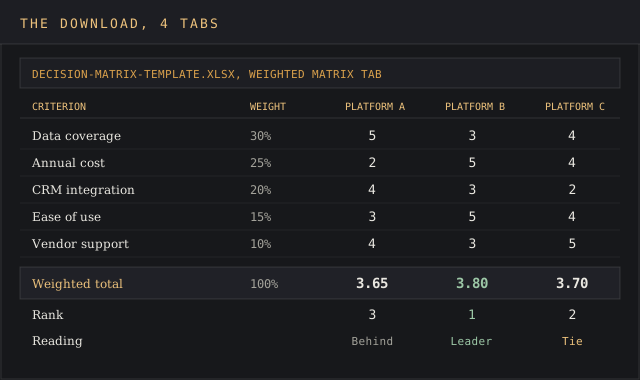
Northvale Analytics, a fictional 45-person B2B software company, needs a competitive intelligence platform for its six-person product marketing team, with a budget cap of $25,000 a year. Three platforms made the shortlist after a two-week evaluation, and all three passed the must-have gate: a SOC 2 Type II report and a native Salesforce connector.
| Criterion | Weight | Platform A | Platform B | Platform C |
|---|---|---|---|---|
| Data coverage | 30% | 5 | 3 | 4 |
| Annual cost | 25% | 2 ($24,000) | 5 ($9,600) | 4 ($14,400) |
| CRM integration | 20% | 4 | 3 | 2 |
| Ease of use | 15% | 3 | 5 | 4 |
| Vendor support | 10% | 4 | 3 | 5 |
| Weighted total | 100% | 3.65 | 3.80 | 3.70 |
| Rank | 3 | 1 | 2 |
Platform B leads at 3.80 on price and ease of use. Its lead over Platform C is 0.10 points, inside the template's 0.15 tie band, so the honest reading is close but no cigar. The unweighted total scores tell even less: 18 for A, 19 for B and 19 for C.
The decision matrix template's Sensitivity tab shows what the decision hinges on. Move 10 points of weight from annual cost to data coverage (40% and 15%) and Platform A jumps from last to first at 3.95, with C on 3.70 and B on 3.60.
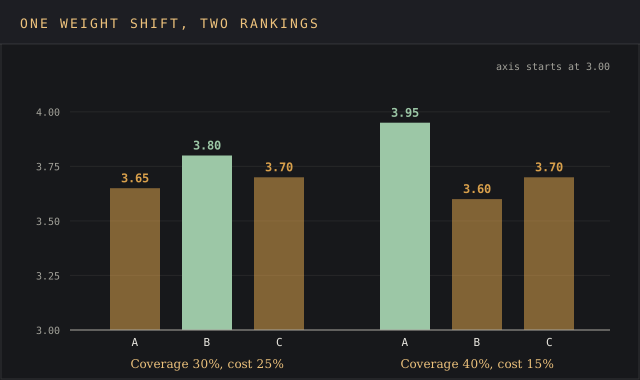
So the weighted decision matrix cut a three-way argument down to one number the team can test with data: the $14,400 a year Platform A costs above Platform B, set against A's broader coverage. That comparison sets the best course of action. The devil's in the details here, so the team logs the coverage insights from each trial in the evidence column.
The Pugh matrix variant
Stuart Pugh developed controlled convergence, the method behind the Pugh matrix, for engineering design in the 1980s as a way to evaluate rough concepts, per the University of Cambridge Institute for Manufacturing. It drops the 1 to 5 scale. One option becomes the datum, and every other alternative is marked better (+1), same (0) or worse (−1) against it on each criterion.
The decision matrix template's Pugh tab runs Northvale's shortlist with Platform B as the datum. Platform A collects three pluses and two minuses for a net +1. Platform C gets two pluses and three minuses for a net −1. Without weights, A beats C, the reverse of the weighted grid, which shows how much the weights carry. Pugh suits early screening of various options while they're still rough concepts. The weighted decision matrix suits the final call.
Mistakes that skew results
- Too many criteria. A weighted decision matrix with twelve criteria at equal weight leaves each one 8.3% of the total, so a 1-point score change moves the result by 0.08. At that size every criterion is too light to move the result.
- Double counting. "Price" and "total cost of ownership" in the same grid are two factors that score cost twice.
- Mixed scale direction. A cost row where 5 means expensive pulls the total the wrong way. Score the cheapest option highest, as the template's cost row does.
- Averaging away disagreement. Two reviewers who give a cell 2 and 5 are describing different products. Settle the gap with evidence before the cell is filled.
- Reading a tie as a win. A 0.05 gap on a 5-point scale is noise from the scoring, and the sensitivity tab will show it.
- Scoring from memory. A score with no evidence behind it is an opinion with a decimal point. Play devil's advocate on the top-ranked option's three highest cells.
- Skipping the review. Six months after you implement the choice, compare the platform's real performance with its scores. That review shows which criteria predicted effectiveness, and those insights sharpen the next matrix.
Excel, Google Sheets or decision making software
A spreadsheet handles every decision matrix up to the size this template covers. The weighted total for one option in Excel is a single formula, =SUMPRODUCT($B$5:$B$12,C5:C12), and Google Sheets runs it unchanged. Sharing a Google Sheets copy lets each reviewer evaluate the options in their own column before the team meets. Teams that rank projects every quarter keep one copy per cycle, so over the course of a year the old scores sit beside each new batch of projects.
Dedicated decision making tool vendors add pairwise weighting, anonymous scoring and audit trails, which matter when a business decision goes to a board or a procurement committee. For a one-off team decision, the decision matrix template in Excel does the same arithmetic for free. It sits well beside other free project management templates on this site, such as the risk assessment matrix template for the risks of the chosen option.
FAQ
How do you use a decision matrix?
Identify the alternatives, define the criteria, assign weights that total 100%, score each option from 1 to 5 on each criterion, then multiply and sum. The highest weighted total is the best option on the numbers, and a sensitivity check on the weights tells you how firm that lead is.
How do I create a decision matrix in Excel?
To create one, put criteria in column A, weights in column B and one option per column from C onward. Under each option, total it with =SUMPRODUCT($B$2:$B$6,C2:C6) and rank the totals with RANK. The decision matrix template above has this built for 8 criteria and 6 options.
What is a weighted grid analysis?
Weighted grid analysis is another name for the weighted decision matrix: options scored against criteria, each score multiplied by the criterion's weight, and the products summed into one total per option. The criteria are the variables, and the weights set how much each one matters.
How do you analyze decision matrix results?
Read the gap between first and second place alongside the rank. A gap under 0.15 points on a 1 to 5 scale is a tie, and the sensitivity check on the weights decides it. Then determine which single criterion drives the lead and verify that one with data.
What is the Pugh decision matrix method?
It compares every option against one reference option, the datum, marking each criterion better, same or worse. Stuart Pugh developed it for engineering concept selection, and it's best for narrowing a long list of early alternatives before a weighted evaluation.
What is the Eisenhower matrix template?
The Eisenhower matrix template is a two-by-two grid that sorts tasks by two yes/no questions: is it urgent, and is it important. The grid carries no weights or scores and suits daily task triage. For one choice between several options, use a weighted decision matrix.
Where can a decision-making matrix be used?
Vendor and software selection, ranking projects in a portfolio, hiring, site selection, choosing between solutions to a recurring problem, and personal choices such as a car or a job offer. Any time a team has to evaluate two or more options on three or more criteria, the grid fits.
Bottom line
Use the decision matrix template when a team has a shortlist of two to six alternatives (vendors, projects, candidates) and keeps arguing past each other because each person weighs the criteria differently. Set the weights first, score with evidence, and run the sensitivity tab before anyone signs off or commits resources. If a 10-point weight shift reverses the ranking, the weight is the decision to debate.
For supplier choices with pricing, delivery and quality data behind them, the vendor evaluation scorecard tracks the same suppliers over time. For comparing priced bids line by line, the bid comparison template is the better tool.