Prioritization Matrix Template
 By Jan Suski. I go deep on every review, checking every number against its source and digging up details other coverage misses, a habit from six years of SEO and link building for tech companies. Bylines at Brand24 and Senuto. How the scoring works.
Get the prioritization matrix template
An Excel workbook that scores up to 30 items against five weighted criteria, ranks them, sorts them into impact effort quadrants and draws the capacity line, pre-filled with a competitive intelligence team's Q1 backlog.
Download XLSXA prioritization matrix is a grid that scores a list of tasks, projects or features against weighted criteria and ranks them by total, so the order of work comes from numbers the team agreed on before anyone argued for a favourite.
ASQ traces it to 1976, when the Union of Japanese Scientists and Engineers set out to build a set of planning tools, and its guide to the seven management and planning tools describes the prioritization matrix as the simpler stand-in teams use for matrix data analysis.
This prioritization matrix template is an Excel workbook that does the two jobs teams ask of it. A weighted scoring table ranks every item, and an impact effort matrix sorts the same items into four quadrants. The page covers the download, the parts of the file, how to set criteria weights, a step-by-step fill-in, a worked example from a three-person competitive intelligence team, the mistakes that skew results, and the software question.
It's for organizations of any size that need to categorize and rank a backlog: product managers ranking features, marketing and research leads with more requests than hours, project management offices deciding which projects get funded, and team leads who have to defend a priority call to stakeholders.
Without a shared scoring method, the loudest request or the most senior sponsor calls the shots. Scoring every item against the same key criteria puts the trade-off on the table. A reviewer can see that the item ranked fifth lost on development effort and argue about that one score, which is a shorter meeting than re-arguing the whole list.
Download the free prioritization matrix template
Download the template (XLSX)Five tabs: instructions, criteria and weights, a 30-row scoring matrix with rank, impact, quadrant and capacity check, an impact effort chart, and a blank copy, pre-filled with the worked example.
The workbook opens in Excel, Google Sheets and LibreOffice Calc. It runs on SUMPRODUCT, RANK, SUMIFS, ROUND and nested IF, all three apps support every one of them, and the automated calculations update rank and quadrant the moment a score changes.
What a prioritization matrix is
The mechanic fits in one sentence. Items go in rows, criteria go in columns, each criterion gets a weight and the weights add up to 100%, each item gets a 1 to 5 score per criterion, and the sheet multiplies and sums. The weighted scores generate a ranked list, and the ranked list records the decision making process so anyone can check it later. That record is what turns a priority call into data driven decisions the team can revisit.
Five methods share the name in practice. Most prioritization templates online stop at one of them, and they answer different questions:
| Method | What it scores | Output | Fits best |
|---|---|---|---|
| Weighted scoring matrix | 3 to 6 criteria, each with a weight | Ranked list with a score per item | Backlogs of 8 to 30 items judged on multiple criteria |
| Impact effort matrix | Impact against effort | Four quadrants | Fast triage in a workshop |
| Eisenhower matrix | Urgency against importance | Do, schedule, delegate, delete | Personal task prioritization |
| RICE | Reach, impact, confidence, effort | One score per item | Product features with usage data |
| MoSCoW | Must, should, could, won't have | Four buckets | Scope under a fixed deadline |
The Eisenhower matrix is a 2×2 grid built on a line Dwight Eisenhower quoted in his 19 August 1954 Evanston address, about having two kinds of problems, the urgent and the important. The site's Eisenhower matrix template covers that grid on its own.
RICE comes from Sean McBride's January 2018 post on the Intercom blog. Reach is people per period, impact is scored 3, 2, 1, 0.5 or 0.25, confidence is 100%, 80% or 50%, and effort is person-months. The score is reach times impact times confidence, divided by effort.
MoSCoW sorts requirements into must, should, could and won't have this time. The Agile Business Consortium's MoSCoW guidance says must-have work should not exceed 60% of the effort, which leaves the rest as contingency.
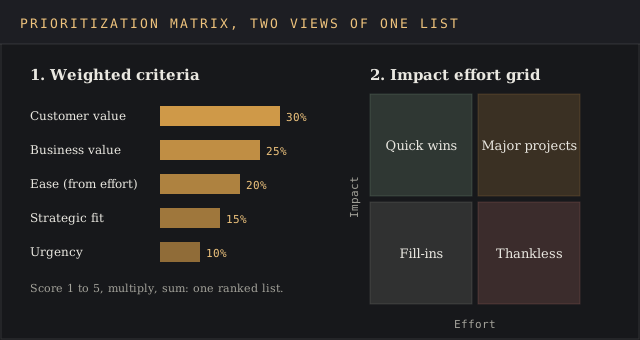
This template combines the first two rows of the table because they answer different questions. The rank sets the order of work, and the quadrant shows what kind of work each item is, which changes how it gets scheduled. Together they give a data driven approach to the two questions every planning meeting asks.
What's inside the prioritization matrix template
| Tab | What it holds |
|---|---|
| Instructions | Scale definitions and a six-step checklist |
| Criteria | Five criteria, their weights, 1 to 5 scale anchors, and a check cell that turns red unless the weights total 100% |
| Matrix | Up to 30 items with scores, ease, weighted score, rank, impact and quadrant, pre-filled with the worked example |
| Quadrant chart | A scatter chart of impact against effort with the cut lines at 3 |
| Blank matrix | The same formulas with no data, ready for your own list |
The structure of the workbook follows the order of work. The weighted score is SUMPRODUCT of the four value scores and their weights, plus ease times the ease weight. Ease is 6 minus the effort score, so low development effort scores high. Impact is the weighted average of the value criteria alone, which keeps effort off both axes of the chart.
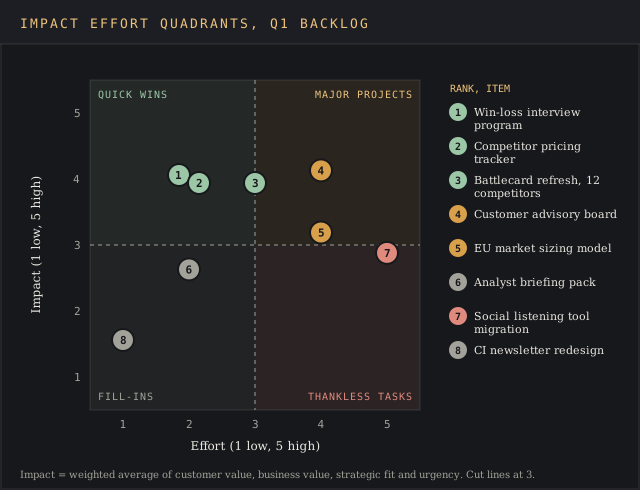
The quadrant rule reads impact and effort together. Impact of 3 or more with effort of 3 or less is a quick win, impact of 3 or more with effort above 3 is a major project, impact under 3 with effort of 3 or less is a fill-in, and anything left is a thankless task.
How to set weighted criteria and criteria weights
The template ships with five criteria. Keep them, rename them to fit your team's specific requirements, or swap one out, but agree the list and the weights before anybody scores an item. Align them with the strategy the team already works to. Weights set after scoring tend to drift toward whatever makes a favourite win, and the devil's in the details there. A five-point swing in one weight can reorder the top of the list.
| Criterion | Weight | What a 5 means | What a 1 means |
|---|---|---|---|
| Customer value | 30% | Top request across the customer base, or blocks renewals | No customer has asked for it |
| Business value | 25% | Tied directly to a revenue target or a measured ROI | No measurable revenue or cost effect |
| Strategic fit | 15% | Named in this year's plan or OKRs as a driver of strategic success | Outside every stated goal |
| Urgency | 10% | A deadline inside the next four weeks | No date attached |
| Ease (from development effort) | 20% | Effort score 1: under one person-week | Effort score 5: more than eight person-weeks |
Three rules keep the criteria weights honest. Use three to six criteria (some guides call them factors), since nine criteria at about 11% each flatten every total toward the middle. Keep any single weight at 40% or below, or that one criterion is the whole decision. And give every score a written anchor, so a 4 means the same thing to everyone in the room.
Resource requirements live in the effort score. Resource availability is a separate question, answered after ranking: count down the ranked list until the effort adds up to the capacity you have. That cut line is how a team with limited resources turns a ranking into a plan.
How to fill in the prioritization matrix, step by step
- List every candidate. Matrix creation starts here, with one item per row, duplicates merged, each written so two people would picture the same piece of work.
- Confirm criteria and weights. Agree them on the Criteria tab with the stakeholders who'll live with the result. The check cell has to read 100%.
- Score alone, then compare. Each scorer fills a copy independently, then the team meets to discuss gaps of two points or more. A consistent scoring system applied by several people cuts the bias any one scorer brings.
- Enter effort as a band. Use the five person-week bands on the Criteria tab. The sheet converts effort to ease on its own.
- Read rank and quadrant together. Sort by the weighted scores, identify the quick wins, then draw the capacity line down the ranked list.
- Review on a schedule. Re-score monthly, or the day a new request arrives that would land in the top five. None of the scores are set in stone.
Prioritization matrix example: a competitive intelligence team's Q1 backlog
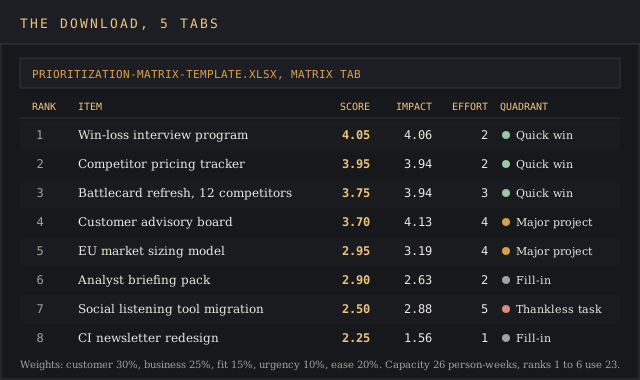
A three-person competitive intelligence team at a 120-person B2B software company has eight requests for Q1 and 26 person-weeks of capacity after recurring work. They scored the backlog with the template's default weights, and the workbook took about an hour to complete, most of it spent discussing the two items with the widest score gaps.
C / B / F / U are the customer value, business value, strategic fit and urgency scores, effort is the 1 to 5 band, Score is the weighted score, and the person-week estimate behind each effort band sits in the last column.
| # | Item | C / B / F / U | Effort | Score | Impact | Quadrant | Weeks |
|---|---|---|---|---|---|---|---|
| 1 | Win-loss interview program | 4 / 4 / 5 / 3 | 2 | 4.05 | 4.06 | Quick win | 2 |
| 2 | Competitor pricing tracker | 3 / 5 / 4 / 4 | 2 | 3.95 | 3.94 | Quick win | 2 |
| 3 | Battlecard refresh, 12 competitors | 4 / 4 / 3 / 5 | 3 | 3.75 | 3.94 | Quick win | 4 |
| 4 | Customer advisory board | 5 / 4 / 4 / 2 | 4 | 3.70 | 4.13 | Major project | 6 |
| 5 | EU market sizing model | 2 / 4 / 5 / 2 | 4 | 2.95 | 3.19 | Major project | 7 |
| 6 | Analyst briefing pack | 2 / 3 / 3 / 3 | 2 | 2.90 | 2.63 | Fill-in | 2 |
| 7 | Social listening tool migration | 3 / 3 / 3 / 2 | 5 | 2.50 | 2.88 | Thankless task | 10 |
| 8 | CI newsletter redesign | 2 / 1 / 2 / 1 | 1 | 2.25 | 1.56 | Fill-in | 1 |
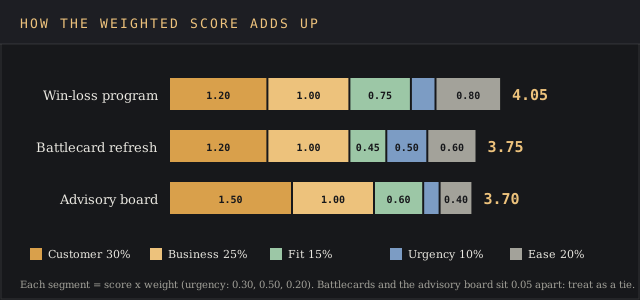
The win-loss program tops the list at 4.05: four points on customer value at 30% weight is 1.20, four on business value at 25% is 1.00, five on fit at 15% is 0.75, three on urgency at 10% is 0.30, and ease of 4 at 20% is 0.80. The team ran it with the site's win-loss analysis template.
Ranks one to six add up to 23 person-weeks, inside the 26 available. The tool migration at rank seven would take 10 more, so it goes on the back burner. The newsletter redesign ranks last, but at one person-week it fits in the three spare weeks, which is the job of a fill-in.
The battlecard refresh beats the advisory board by a hair's breadth, 3.75 to 3.70. Move 5 points of weight from urgency to strategic fit and the order flips to 3.80 for the board and 3.65 for the battlecards. Treat any gap under 0.10 as a tie and let the quadrant break it. The battlecards are a quick win due in four weeks, built on the competitor battlecard template, so they go first.
Run the sensitivity check on any top-five pair closer than 0.10. If a modest weight change flips them, the matrix has done its job by showing that the call is a judgment, and the team should make it out loud.
Prioritize tasks with the four impact effort quadrants
The quadrant names come from the action priority matrix as Mind Tools publishes it, which lists its originator as unknown. Each quadrant gets a different kind of scheduling, and a different focus:
- Quick wins (high impact, low effort): immediate action. Identify these first. Start them this week, since they return the most per hour and get the ball rolling on the rest.
- Major projects (high impact, high effort): schedule them with milestones and a named lead. One major project can crowd out several quick wins, so cap how many run at once.
- Fill-ins (low impact, low effort): use spare capacity, or delegate them. The RACI matrix template records who owns a delegated item.
- Thankless tasks (low impact, high effort): drop, rescope or renegotiate. These tasks require high effort for a low return, so the first question is if anyone needs them done at all. If nobody does, cut your losses early.
Quadrants also tell you what to fix in a weak item, and that's one of the benefits a plain ranked list can't give. A thankless task with one high score can often be cut down to a fill-in. The tool migration above shrinks to three person-weeks if the team moves only the two dashboards people use, and a smaller version can unlock a later major project.
Mistakes that skew a prioritization matrix
- Scoring effort the same way as value. A 5 for effort then adds points to the most expensive work. The template converts effort to ease to stop this.
- Setting weights after scoring. The weights should come from the strategy. Weights picked after scoring can be tuned until a favourite wins.
- Treating a 0.05 gap as a verdict. Scores carry the rounding of human judgment, so close pairs are ties.
- Scoring in private and announcing the result. Teams accept a ranking they helped score. Collaborative scoring keeps the process transparent and fair, and it puts everyone on the same page before the work starts.
- Never updating. A matrix is a snapshot of one month. Requests, deadlines and capacity change, and the scores should follow.
- Using it for a single either/or choice. Picking one vendor or one location is a different job, and the decision matrix template is built for it.
Excel, Google Sheets or prioritization software
A spreadsheet tool handles a backlog of up to about 30 items scored by a handful of people, which covers most marketing, research and project management teams in practice. Every formula is visible, the file travels by email, and a print of the quadrant tab works as a paper version for a workshop wall.
Prioritization software earns its keep when the backlog runs into the hundreds, several teams score it, and the scores need to sit on the backlog records themselves with automation updating them as fields change.
Product management software built for feature requests stores the scores next to the users who asked for them, which product managers find helpful when they report back on features. The investment in setup and licences repays itself only at that scale, the same ROI test you'd apply to any item on the matrix.
For a quarterly backlog like the one above, the spreadsheet is faster to set up and easier to audit. When the ranked list turns into dated work, move it into the action plan template.
FAQ
How do you create an impact effort matrix?
Score each item 1 to 5 on impact and on effort, draw a 2×2 grid with effort on the horizontal axis and impact on the vertical, and place each item by its two scores. The template calculates impact from four value criteria and plots the chart for you.
What are the four quadrants of an impact effort matrix?
Quick wins (high impact, low effort, immediate action), major projects (high impact, high effort), fill-ins (low impact, low effort) and thankless tasks (low impact, high effort). Quick wins go first, major projects get scheduled, fill-ins use spare time, and thankless tasks get dropped or rescoped.
What is the Eisenhower matrix template?
It's a 2×2 grid that sorts tasks by urgency and importance into do, schedule, delegate and delete, so urgent but minor tasks stop crowding out important ones. It suits one person's week. A team backlog judged on several criteria needs a weighted prioritization matrix.
What is a decision matrix in project management?
A decision matrix scores a few alternatives against weighted criteria to pick one, such as a vendor or a site. A prioritization matrix uses the same arithmetic to rank many items and keep most of them, so the output is an order of work.
What are the 5 priority levels for tasks?
No single standard exists, and each tracker defines its own labels. A practical way to get five levels from this template is to band the weighted score: 4.00 and above is P1, 3.50 to 3.99 is P2, 3.00 to 3.49 is P3, 2.50 to 2.99 is P4, and anything lower is P5.
What is the best prioritization method?
The right method depends on the decision. Use weighted scoring for a mixed backlog of projects and tasks, RICE when you have usage data on reach (explore Intercom's post for its scales), MoSCoW when the deadline is fixed and scope has to give, and the Eisenhower matrix for personal task prioritization.
Bottom line
Reach for this prioritization matrix template when a team has more requests than capacity and needs an order of work it can defend, and when stakeholders want to see how the call was made so they can make informed decisions of their own. The weighted score gives the rank, the quadrant gives the type of work, and the capacity line turns both into a quarter's plan.
For one person's week, the Eisenhower matrix is the lighter tool. For a single choice between a few options, use the decision matrix. This file is built for ranking a long list when most of it will get done in some order.