Digital Transformation Roadmap Template
 By Jan Suski. I go deep on every review, checking every number against its source and digging up details other coverage misses, a habit from six years of SEO and link building for tech companies. Bylines at Brand24 and Senuto. How the scoring works.
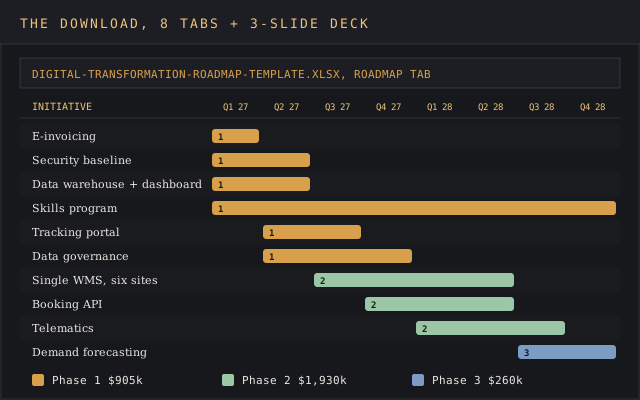
Get the digital transformation roadmap template
An Excel workbook that runs the program, from maturity scores and an initiative portfolio to a quarter-by-quarter roadmap, KPI tracker, risk register and budget, plus a three-slide PowerPoint deck for the board.
Download XLSX Download PPTX deckA digital transformation roadmap is a time-phased plan that connects technology investments to business goals. It records where the organization stands today, where it intends to be, which initiatives close the gap, in what order, who owns each one, and how progress gets measured. A strategy sets the direction and the reasons for it, and the roadmap schedules the work that delivers it.
The odds make the plan worth the effort. In McKinsey's 2018 survey of 1,793 respondents, 16% said their digital transformation improved performance and sustained the gains.
BCG's 2020 research, built on its work with 70 companies and a survey of 825 senior executives, put the success rate at 30%, and found that getting six factors right lifted it to 80%. Two of those six are an integrated strategy with clear goals and effective monitoring of progress, which is the job of this document.
This digital transformation roadmap template is an Excel workbook with a three-slide PowerPoint deck alongside it. The page covers both downloads, the key components of a roadmap, how organizations assess digital maturity, a step-by-step build, a worked example from a regional logistics operator, a marketing variant, common mistakes, and the Excel or PPT template question.
It's for CIOs and chief digital officers, transformation managers and program leads, strategy consultants preparing a client roadmap, and operations executives at mid-size companies who've been handed a transformation budget and a deadline for the first board update.
Download the free digital transformation roadmap template
Download the roadmap workbook (XLSX)Eight tabs: instructions, vision and goals, maturity, initiatives, an eight-quarter roadmap grid, KPIs, risks and budget, pre-filled with the Northline Logistics example.
Download the board deck (PPTX)Three slides: roadmap on a page, KPI scorecard and the decisions the board is asked for, built from the same example.
The workbook opens in Excel, Google Sheets and LibreOffice Calc, and the deck opens in PowerPoint, Google Slides and Keynote. The workbook runs on SUMIFS, INDEX/MATCH and IF, and the quarter grid is drawn by conditional formatting, so it survives an import into any of the three spreadsheet apps.
What a digital transformation roadmap covers
Three documents get confused in most transformation programs. Each answers a different question, and a team that writes one while thinking it wrote another ends up back to the drawing board at the first steering meeting.
| Document | Question it answers | Horizon | Typical owner |
|---|---|---|---|
| Digital transformation strategy | Why change, and what does the business look like afterwards? | 3 to 5 years | CEO and executive team |
| Digital transformation roadmap | Which initiatives, in which order, owned by whom, measured how? | 18 to 36 months, by quarter | Transformation lead or CDO |
| Project plan | Which tasks, by which date, for one initiative? | Weeks to months | Project manager |
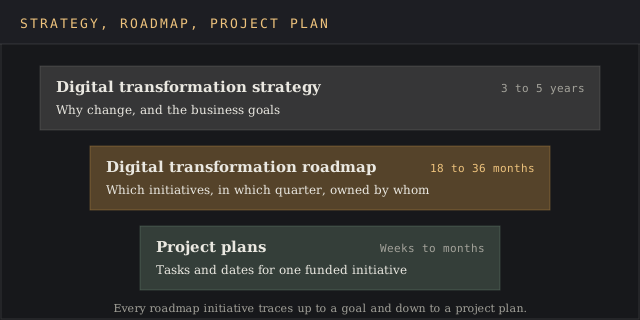
A digital transformation strategy template usually stops at goals and themes. This roadmap template picks up where it stops. It takes the goals from the digital transformation strategy and turns them into digital transformation initiatives with dates, owners and budgets. Consultants often deliver the strategy and a first roadmap, and the workbook lets the internal team keep it running after they leave.
The roadmap sits in the middle and keeps the other two honest. Every initiative on it traces up to a business goal in the strategy, and every initiative breaks down into a project plan once it's funded. A roadmap that can't show that link for an initiative is carrying a pet project.
Digital initiatives on a roadmap range from moving invoices online to applying big data and Internet of Things sensors to a fleet. McKinsey's survey found that organizations with successful transformations deployed more technologies than others, including artificial intelligence and the Internet of Things. New technologies earn a place on the roadmap when they support a business goal, and the roadmap is where that link gets written down for each one.
A roadmap also needs room for innovation. Keep a small budget line for experiments with new technology, scored like any other initiative once a test shows a business result.
A good roadmap also plans the change for people and processes alongside the new digital tools, because a new platform that nobody adopts produces the cost of the transformation with none of the return.
Key components of a digital transformation strategy template
Every strong digital transformation strategy template carries the same ten parts, whatever the industry. The structure of this workbook follows them, so it doubles as a blueprint for the program, with a tab or a column for each:
- Vision and business goals. One sentence on the end state, and three to five business goals with a metric each.
- Current-state assessment. A digital maturity score per workstream, plus an inventory of the technology landscape that flags legacy systems.
- Target state. The maturity score each workstream should reach by the end of the roadmap.
- Gap analysis. Target minus current, which shows where the money should go.
- Initiative portfolio. Every candidate initiative, scored on business value and complexity.
- Phased timeline. Initiatives laid out by quarter in phases with clear milestones.
- KPIs. A baseline, a target and a date for each goal, so the team can track progress.
- Governance. Owners, a steering group and a review cadence, so accountability has names attached and the program manager can track progress against each milestone.
- Budget and resources. Cost per initiative and per phase, the financial planning a funding request needs.
- Risks and change management. A risk matrix with mitigations, and the training plan that gets people to use what's built.
Many consulting frameworks open with a SWOT assessment before step one. It's a useful warm-up, and the site's SWOT analysis template works for it, but the maturity scores in step two do the heavier lifting.
How organizations assess digital maturity
IDC's MaturityScape is the best-known benchmark. Its 2015 digital transformation series scores organizations in five stages (ad hoc, opportunistic, repeatable, managed and optimized) across five dimensions: leadership, omni-experience, worksource, operating model and information.
The template uses a simpler 1 to 5 scale across five workstreams that map to the same ground. Organizations assess digital maturity in three steps:
- Score the current state. Rate each workstream 1 to 5 against the anchors on the Maturity tab, with evidence written next to each score.
- Benchmark against peers. Compare scores with industry data where you have it, such as an analyst benchmark, a trade association survey or a consultant's peer set. Without one, compare the score with your two strongest competitors as customers would experience them.
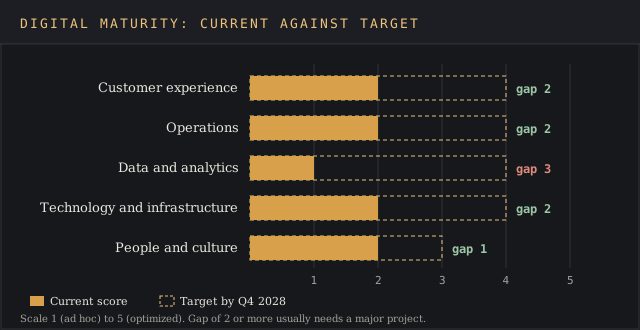
- Set the target and read the gap. A gap of 2 or more marks a workstream that needs a major project. A gap of 1 usually closes with quick wins. The scores give the first insights into where the money should go.
| Workstream | What a 1 looks like | What a 5 looks like |
|---|---|---|
| Customer experience | Phone and email only, no self-service | Customers book, track and pay online, and the experience adapts to customer needs |
| Operations | Paper and spreadsheets, manual handoffs | End-to-end automation with exceptions routed to people |
| Data and analytics | Reports built by hand from exports | One governed data platform, daily dashboards, predictive models in use |
| Technology and infrastructure | Several legacy systems with no integration | Cloud platform, documented APIs, security and compliance built in |
| People and culture | Training is ad hoc, change is imposed | Digital skills in every role, a standing change network |
Data management comes before data analytics in most sequences. Ownership, quality rules and master records have to exist before dashboards can be trusted, because a dashboard built on unmanaged data reports the errors faster.
The technology landscape inventory sits behind the Technology score. List every system, its age, what it connects to, and who depends on it. Legacy systems with many dependencies set the sequencing for everything else on the roadmap.
What's inside the digital transformation roadmap template
| Tab or slide | What it holds |
|---|---|
| Instructions | The scales, the quadrant rule and a ten-step checklist |
| Vision and goals | The vision statement and five business goals with metrics |
| Maturity | Current and target scores per workstream, with the gap calculated |
| Initiatives | Up to 40 initiatives with workstream, value, complexity, quadrant, phase, start and end quarter, owner, budget and KPI |
| Roadmap | An eight-quarter grid that fills itself from the start and end quarters, colored by phase |
| KPIs | Baseline, current and target values with an on-track or at-risk status |
| Risks | Likelihood times impact scoring with a rating, mitigation and owner |
| Budget | Spend by phase and by workstream, summed from the Initiatives tab |
| Deck, slide 1 | Roadmap on a page: three phases across five workstreams |
| Deck, slide 2 | KPI scorecard for the board |
| Deck, slide 3 | Decisions and funding the board is asked for |
The quadrant formula scores each initiative on business value and complexity. Value of 3 or more with complexity of 3 or less is a quick win, value of 3 or more with higher complexity is a major project, low value with low complexity is a fill-in, and the rest get flagged to reconsider. The same logic drives the site's prioritization matrix template, which goes deeper on weighted scoring.
How to build a digital transformation roadmap, step by step
- Define the vision in one sentence. Name the customer and the outcome. "Every customer can book, track and pay without calling us" works, and "become a digital leader" doesn't, because nobody can measure it.
- Set three to five business goals. Each one gets a metric, a baseline and a target date. These become the KPI tab.
- Score current maturity. Run the assessment with the people who do the work as well as the executives who sponsor it, and write the evidence next to each score.
- Set targets and read the gaps. Put the largest gap first in the conversation about money.
- Develop the initiative list. Gather candidates from each workstream and link each one to a goal. An initiative with no goal gets cut or parked.
- Score value and complexity. Agree the scores in one session so the scale means the same thing across workstreams. That session is where stakeholder alignment happens, and skipping it shows up later as owners defending their own projects against the plan.
- Sequence into phases. Give each phase one focus. Put quick wins and enabling foundations first, and start major projects once their dependencies land. Run quick wins alongside the larger infrastructure projects so the program shows results while the heavy lifting goes on.
- Cost it. Estimate budget per initiative, add contingency, and check the phase totals against what finance will release.
- Assign governance. Name an owner per initiative, a steering group, and a sponsor who can unblock decisions. The RACI matrix template records who's responsible and who's consulted.
- Plan change and set the review cadence. Write the training and communication plan, then review the roadmap monthly at working level and quarterly with the steering group.
Digital transformation roadmap example: a regional logistics operator
Creating the roadmap is easier to follow with numbers. Northline Logistics is a fictional third-party logistics company with 420 employees and six warehouses. Shippers book by email and phone, two warehouse management systems run side by side, and invoices go out nine days after dispatch. The executive team has approved a two-year program starting in Q1 2027, and the roadmap has to show what it will achieve by when.
The vision reads: "By the end of 2028, every customer can book, track and pay for a shipment without calling us, and all six warehouses run on one system." Five business goals carry it:
| KPI | Baseline | Target | Measured from | Target date |
|---|---|---|---|---|
| Order-to-dispatch time | 26 hours | 12 hours | Q3 2027 | Q4 2028 |
| On-time delivery | 91% | 97% | Q1 2028 | Q4 2028 |
| Service calls per 100 shipments | 18 | 7 | Q2 2027 | Q4 2028 |
| Dispatch-to-invoice time | 9 days | 1 day | Q1 2027 | Q2 2027 |
| Share of shipments booked online | 22% | 70% | Q2 2027 | Q4 2028 |
Northline's maturity assessment scored customer experience 2 against a target of 4, operations 2 against 4, data and analytics 1 against 4, technology and infrastructure 2 against 4, and people and culture 2 against 3. Data and analytics carries the widest gap at 3, so its initiatives start in the first quarter.
| # | Initiative | Workstream | Value | Complexity | Quadrant | Phase | Quarters | Budget |
|---|---|---|---|---|---|---|---|---|
| 1 | E-invoicing and automated billing | Operations | 4 | 2 | Quick win | 1 | Q1 2027 | $90k |
| 2 | Security baseline: single sign-on, MFA, access reviews | Technology | 3 | 2 | Quick win | 1 | Q1 to Q2 2027 | $85k |
| 3 | Cloud data warehouse and daily operations dashboard | Data | 4 | 3 | Quick win | 1 | Q1 to Q2 2027 | $180k |
| 4 | Digital skills program and 40-person champion network | People | 3 | 2 | Quick win | 1 | Q1 2027 to Q4 2028 | $160k |
| 5 | Customer tracking portal | Customer experience | 5 | 3 | Quick win | 1 | Q2 to Q3 2027 | $240k |
| 6 | Data governance and master data cleanup | Data | 3 | 4 | Major project | 1 | Q2 to Q4 2027 | $150k |
| 7 | Single warehouse management system across six sites | Technology | 5 | 5 | Major project | 2 | Q3 2027 to Q2 2028 | $1,200k |
| 8 | Online booking API for the top 40 shippers | Customer experience | 4 | 4 | Major project | 2 | Q4 2027 to Q2 2028 | $310k |
| 9 | Telematics and route planning for the fleet | Operations | 4 | 4 | Major project | 2 | Q1 to Q3 2028 | $420k |
| 10 | Demand forecasting model | Data | 3 | 5 | Major project | 3 | Q3 to Q4 2028 | $260k |
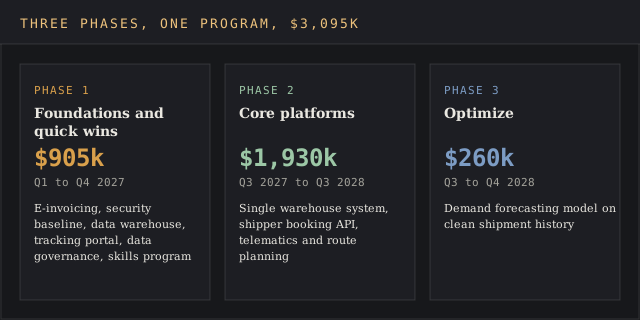
The program totals $3,095k. Phase 1, foundations and quick wins, takes $905k. Phase 2, core platforms, takes $1,930k, of which the warehouse system is $1,200k. Phase 3, the forecasting model, takes $260k and starts last, because a forecast needs consistent shipment history from the new warehouse system and the cleaned master data.
For Northline's customers the visible change comes in Q3 2027, when the tracking portal goes live and shippers can check a pallet's status online. That change is the competitive edge the vision describes, and it lands before any of the major projects. Project management for each initiative then runs in the team's usual tools, with the roadmap holding the dates the board sees.
The order follows dependencies. E-invoicing ships in the first quarter because it needs nothing else, and it moves the dispatch-to-invoice KPI from 9 days toward 1 within months. The data warehouse comes before the booking API, because the API needs one version of each shipper's record. The warehouse system cutover stays out of October to December, the peak season, and runs site by site.
At the end of Q2 2027 the KPI tab shows invoice time at 1.5 days, 94% of the way to target against 100% planned, so on track. Service calls sit at 17 per 100 and online bookings at 24%, both on track because their planned curves have barely started. Order-to-dispatch time and on-time delivery show "Not started", since the initiatives that move them haven't landed. That status keeps a board from reading an early flat line as failure.
The risk tab scores five risks by likelihood times impact. The highest is a warehouse cutover that disrupts peak season, at 3 times 5 for a score of 15 and a high rating, mitigated by the no-peak rule and a rollback plan per site. Data quality that blocks the dashboard scores 4 times 3 for 12, a medium rating, which is why master data cleanup starts in Q2 2027 and not later.
Measure each KPI from the quarter its initiative lands. A KPI measured from day one will read "at risk" for a year on any roadmap with a major project in Phase 2, and a board that sees red for a year stops trusting the document.
Adapting the roadmap for a marketing digital transformation
A marketing digital transformation uses the same workbook with different workstreams. Swap the five rows on the Maturity tab for marketing data, marketing technology, content and channels, customer engagement, and team skills, and the gap analysis works the same way.
The initiatives change shape, and so does the company's definition of success. Typical quick wins are consent-based email automation, a single marketing analytics dashboard, and cleanup of the CRM fields that digital marketing campaigns depend on. Typical major projects are a customer data platform, account-based marketing across sales and marketing, and a rebuilt website.
Goals shift toward the customer as well. Marketing roadmaps track customer engagement, customer satisfaction, pipeline from digital channels and market share, and they start from research into customer needs.
The site's customer journey map template captures where customers get stuck, and the customer engagement strategy template turns that into a plan the roadmap can schedule. Data analytics ties the two together, since a marketing team that can't measure a channel can't prioritize it.
Download the board deck (PPTX)
Excel roadmap or PowerPoint: which PPT template fits board presentations
The two downloads do different jobs. The Excel roadmap is the working document. It holds up to 40 initiatives, recalculates budgets, and updates the quarter grid when a date moves. The PowerPoint deck is the version executives see, three slides short enough for one agenda item.
PPT template galleries such as SlideTeam sell slide designs, and framework marketplaces such as Flevy sell toolkits written by former consultants for strategy work. A board needs three answers: where the program stands, how the KPIs are moving, and which decisions it has to make. The deck's three slides cover those, and the figures on them come from the workbook, so they stay consistent with what the team works from.
Keep the workbook as the source of truth and rebuild the deck from it before each steering meeting. A deck edited on its own drifts from the plan within a quarter, and then two versions of the roadmap compete for the same budget.
Common mistakes with a digital transformation roadmap
- Starting from technology. A roadmap that opens with "move to the cloud" has skipped the business goals. Start from customer needs and business goals, then pick the technology.
- All major projects and no quick wins. A program with nothing to show for 12 months puts its sponsor in an awkward spot at every board meeting. Put two or three quick wins in the first two quarters.
- Treating the roadmap as set in stone. It's a living document. Re-sequence when a dependency slips or a new technology changes the cost of an initiative.
- Skipping change management. When budgets tighten, training and communication are the easiest lines to cut, and adoption depends on both. Fund the people workstream as its own line.
- Ownership by committee. Every initiative needs one named owner. Shared ownership means nobody chases the slipped milestone.
- Too many initiatives at once. Biting off more than the team can chew spreads people across ten half-finished projects. Cap Phase 1 at what the team can staff.
- Vanity KPIs. Licenses bought or systems launched measure activity. Measure the business result the system was bought for.
Excel, Google Sheets or roadmap software
A spreadsheet handles a roadmap of up to about 40 initiatives managed by one transformation team. It's free, every formula is visible, and finance can audit the budget tab without a new login.
Roadmap and project management software pays off once several teams update the plan at once, initiatives link to live project data, and executives want a dashboard without waiting for the monthly deck. At that point, export the Initiatives tab to CSV and import it into the tool. Until then, the spreadsheet keeps the focus on decisions over tool setup. Download the workbook, replace the Northline rows with your own, and the Roadmap and Budget tabs rebuild themselves.
FAQ
How do you create a digital strategy?
Start with the business goals, assess current digital maturity, define the target state, and list the initiatives that close the gap. Score them on value and complexity, sequence them into phases, and set KPIs with baselines. A digital transformation strategy states the goals, and the roadmap turns them into scheduled initiatives.
What are the 5 pillars of digital transformation?
No single standard list exists. IDC's MaturityScape uses five dimensions: leadership, omni-experience, worksource, operating model and information. This template uses five workstreams: customer experience, operations, data and analytics, technology and infrastructure, and people and culture.
What are the three pillars of digital transformation?
The most common three-part version is people, process and technology. It's a useful check that a roadmap funds training and process redesign alongside the technology itself.
What is digital transformation in logistics?
It's the move from phone, email and paper to connected systems for booking, warehousing, transport and billing. The worked example above covers a typical program: e-invoicing, a customer tracking portal, one warehouse management system, a shipper booking API, fleet telematics and demand forecasting.
Is there a digital transformation roadmap PPT template?
Yes. The download on this page includes a three-slide PowerPoint deck: a roadmap on a page, a KPI scorecard and a decisions slide. It's a PPT template built to be filled from the workbook, and it opens in PowerPoint, Google Slides and Keynote.
Can ChatGPT create a roadmap?
A large language model can draft an initiative list and a first sequence from a prompt. It has no view of your systems, budget, contracts or maturity scores, so treat the output as a brainstorm and score every item in the template before it goes near a board.
How often should a digital transformation roadmap be updated?
Review it monthly at working level to update status and dates, and quarterly with the steering group to re-sequence and re-fund. A full rebuild makes sense once a year, or when the strategy changes.
Bottom line
Use this digital transformation roadmap template when a transformation has a budget and a sponsor and needs a plan that links every initiative to a business goal, a quarter, an owner and a KPI. The team runs the program week to week in the workbook, and the deck reports progress to the board from the same figures.
If the strategy itself isn't settled yet, start with the strategic plan template and come back once the goals are agreed. For a single technology decision inside the roadmap, such as choosing a warehouse system vendor, the vendor evaluation scorecard is the better fit.