Gartner vs Forrester
 By Jan Suski. I go deep on every review, checking every number against its source and digging up details other coverage misses, a habit from six years of SEO and link building for tech companies. Bylines at Surfer, Brand24, and Senuto. How the scoring works.
| WHAT EACH ONE DOES | GARTNER | FORRESTER |
|---|---|---|
| Core job | IT research seats | CX and B2B research |
| Vendor ranking | Magic Quadrant | Forrester Wave |
| Scored on | Execute + vision | Offering + strategy |
| Rating tiers | 4 quadrants | 3 tiers since Dec 2024 |
| Analyst inquiry | 30-minute sessions | Unlimited on G-Cloud |
| Events revenue | $244.2M in Q2 2026 | $13.1M in all of 2025 |
| Coverage | 143 Magic Quadrants | IT, CX, B2B, security |
| Emerging tech | Hype Cycle, clients only | In Forrester Decisions |
| AI tool | AskGartner | Forrester AI (ex-Izola) |
| Vendor-paid output | Paid MQ reprints | Commissioned TEI |
| Skip it if | Your team is CX-first | You need IT shortlists |
| WHAT YOU GET | GARTNER | FORRESTER |
|---|---|---|
| UK leader seat | £64,200 a year | £36,161.75 a year |
| UK team seat | £9,900 to £24,100 | £12,350 |
| Vendr median | $76,002 (149 deals) | $64,240 (67 deals) |
| Vendr range | $27,126-$289,667 | $25,444-$173,860 |
| Term | Non-cancelable | 12 or 24 months |
| Billing unit | Named seat, by role | Licensed users |
| 2025 revenue | $6.5B | $396.9M, down 8% |
| Contract value | $5.3B, up 1.7% | $283.2M, down 3% |
| Wallet retention | 97.0% | 87% |
| Employees | 20,244 | 1,474 |
| Finances | Stock -47.9% in 2025 | $110.7M impairments |
StrongerWeakerNo edge
Thirty-one further documented limits sit behind the button below: inquiry rules, GSA bundle prices, G-Cloud seat inclusions, Wave and TEI rules, and filing figures. Pricing rows assume a UK public body buying one leader seat and one team seat off G-Cloud, set against Vendr’s commercial medians. The Magic Quadrant count, Vendr’s Forrester header and every G-Cloud and SEC page were read 17 October 2026; Vendr’s Gartner figures and the GSA schedule on 6 October 2026.
| Gartner | WHAT IT DOCUMENTS |
|---|---|
| Document review cap | 20 pages per review |
| Written analysis | No redlines or line-by-line pricing analysis |
| Inquiry entitlement | “Licensed User with Inquiry Service” only |
| Vendor briefings | Free, typically 45 minutes, 1-2 analysts |
| Client interactions | 510,000+ claimed |
| Technical Professionals | 1 leader + up to 4 members, $69,424 |
| Extra bundle member | $13,310 |
| Group size cap | 1 leader + up to 10 members |
| Multi-license price | $37,730 per Advisor seat with 2+ licenses |
| Two-year order | 5% off year one |
| Symposium pass | $8,200 standard, $6,125 public sector, 1 free per 4 paid |
| Role Team Member | Team inquiry, phone support 9-5 UK time |
| Executive Programs | £35,900, Team Plus Advisor Leader with Industry |
| Software engineering | £91,800, Executive Individual Access |
| Forrester | WHAT IT DOCUMENTS |
|---|---|
| Webinars | Unlimited on Leader seat |
| Event ticket | 1 Forum ticket on Leader seat |
| Success manager | Dedicated, on Leader seat |
| Team Access inclusions | Core IT portal, benchmarks, 1 event ticket |
| Wave inclusion example | Annual revenue of at least $50M, set per Wave |
| Lab-based Waves | Questionnaire covers strategy and market presence criteria only |
| Wave digital experience | Interactive comparison, custom shortlists |
| Landscape vendors | Notable providers shown in the Wave experience |
| TEI components | Cost, benefits, flexibility, risk |
| TEI separation | Kept out of syndicated research |
| Forrester AI launch | October 2023, as Izola |
| Microsoft integration | Teams and Copilot |
| Client retention | 77% in 2025, 73% in 2024 |
| Sales staff | 553 of 1,474 employees |
| Revenue mix 2025 | Research $295.6M, consulting $88.2M |
| Event regions | North America, Europe, Asia-Pacific |
| 2026 restructuring cost | $4.2M to $4.5M expected |
Where the seat prices, retention figures and Wave rules come from
Company figures come from Gartner’s 10-K for fiscal 2025 and Q2 2026 8-K on sec.gov, and Forrester’s 10-K for fiscal 2025 on sec.gov and its Q2 2026 release on forrester.com. Seat prices come from the UK Digital Marketplace’s G-Cloud 13 (Forrester) and G-Cloud 14 (Gartner) listings and Gartner’s GSA schedule 47QTCA18D008L. Contract medians are Vendr header figures.
Methodology rules are each firm’s own pages: Gartner’s Magic Quadrant FAQ, methodology, Hype Cycle, inquiry, content compliance, vendor briefing and Ombuds pages, and Forrester’s Wave methodology, Wave enhancements release and TEI policy. Court records are from courtlistener.com and law.justia.com. Figures were read 17 October 2026, Gartner’s GSA and Vendr figures on 6 October 2026.
Neither firm publishes a commercial rate card, a numeric inquiry allowance, renewal uplift caps or termination-for-convenience terms, and Forrester publishes no analyst headcount, so no row claims one.
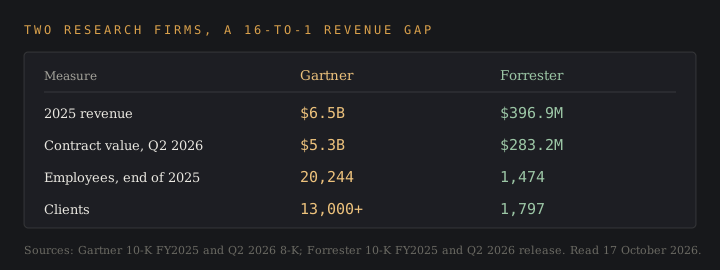
Gartner is the bigger and pricier research firm, and Forrester is the cheaper seat, with unlimited analyst inquiry on its UK government listing. Gartner booked $6.5 billion of revenue in 2025 against Forrester's $396.9 million, a 16-to-1 gap, and Vendr's buyer data puts the median contract at $76,002 for Gartner and $64,240 for Forrester.
This comparison is for buyers holding a renewal quote from one of the two analyst firms, from IT directors to CX leaders and procurement organizations, and for software companies planning where to spend analyst relations money. It covers public seat prices, how each firm scores vendors and their solutions, contract terms and the trends behind each company's finances.
The pick matters because both sell prepaid annual contracts and Gartner's GSA terms make its seats non-cancelable, so a wrong choice is a five- or six-figure bill for at least 12 months. Forrester's 2026 revenue guidance is $350 million to $360 million, down as much as 11.8%, and a shrinking research company negotiates differently from one still reporting growth.
↑ COMPARISONGartner, Forrester and IDC by size: revenue, clients and analysts
Both companies run the research industry's standard business model: an annual subscription to research, analyst reports and time with analysts, priced per named user. Forrester's own 10-K names Gartner as a principal direct competitor. The difference is scale. Gartner employs 20,244 people to Forrester's 1,474 and holds the larger market share by revenue; the data below comes from each firm's SEC filings and its own pages.
| Measure | Gartner | Forrester |
|---|---|---|
| 2025 revenue | $6.5 billion | $396.9 million, down 8% |
| Q2 2026 revenue | $1,675.9 million, down 0.6% | $100.2 million, down 10.3% |
| Contract value | $5.3 billion, up 1.7% (Q2 2026) | $283.2 million, down 3% (Q2 2026) |
| Employees | 20,244 (end of 2025) | 1,474 (end of 2025) |
| Client base | 13,000+ enterprises in about 90 countries | 1,797 clients in about 68 countries |
| Wallet retention | 97.0% (Q2 2026) | 87% (2025) |
| Analysts named on its site | 2,400+ | No published count |
| Signature methods | Magic Quadrant, Hype Cycle | Forrester Wave, Total Economic Impact |
Gartner's data comes from its 10-K for fiscal 2025 and its Q2 2026 results of 4 August 2026. Forrester's data comes from its 10-K for fiscal 2025 and its Q2 2026 release of 30 July 2026, all read 17 October 2026.
Gartner's market presence sits in IT. Its Global Technology Sales unit carries $4.0 billion of the $5.3 billion in contract value, three dollars in four. Forrester's events are built around B2B marketing, customer experience and security, and Forrester Consulting is focused on what the 10-K calls "customer obsessed strategies". The usual claim holds: Gartner is a technology research firm, Forrester a source of business and customer insights.
Client counts point the other way. Gartner lost 1,085 technology client enterprises over 18 months to mid-2026, falling from 12,432 to 11,347, while contract value per technology client rose from $315,000 to $352,000, per its quarterly reports. Demand per customer is up, and there are fewer customers. Forrester lost 145 customers in 2025, falling from 1,942 to 1,797, with client retention at 77%.
↑ COMPARISONGartner Magic Quadrant vs Forrester Wave: how analysts score vendors
The Gartner Magic Quadrant and the Forrester Wave are the two vendor reports most buyers have heard of. The Wave changed shape in December 2024, and most industry comparison reports ranking for this query still describe the old one.
| Rule | Gartner Magic Quadrant | Forrester Wave |
|---|---|---|
| What gets scored | Ability to Execute and Completeness of Vision | Current offering and strategy, plus customer feedback since December 2024 |
| Criteria | Up to 15 weighted criteria across the two axes | Criteria set by analysts per Wave, weights editable by subscribers |
| Vendor categories | Leaders, Challengers, Visionaries, Niche Players | Leader, Strong Performer, Contender (three tiers since December 2024) |
| Client status | "Vendor status as a Gartner client does not affect inclusion or positioning" | Vendors check their scorecard for "errors of fact" and get a 48-hour preview |
| Cadence | Typically annual; 143 Magic Quadrants listed, 92 updated in the prior 12 months | Three weeks for vendors to answer each questionnaire |
Gartner's Magic Quadrant FAQ calls magic quadrants "a starting point" and points buyers to Critical Capabilities, Gartner Peer Insights and calls with analysts alongside them. Its methodology page warns that "focusing on the leaders' quadrant isn't always the best course of action". The count of 143 magic quadrants comes from Gartner's research list as read on 17 October 2026.
Forrester announced the Wave redesign on 5 December 2024. In that evolution, the graphic went from four tiers to three, and "customer feedback representation replaces market presence". The bands are now Leaders, Strong Performers and Contenders, and Challengers, the old fourth band, is gone.
Chief research officer Sharyn Leaver said Forrester analysts weigh "product capabilities and strategic vision", the current offering and strategy pair. The Wave methodology page says "clients are encouraged to modify the weightings in the spreadsheet to create custom vendor shortlists".
The common line that Gartner is qualitative and consensus-driven while Forrester is quantitative and prescriptive at the feature level holds up only partly. Both publish weighted criteria, up to 15 at Gartner, and both let subscribers reweight them. Both firms' analysts call their ratings opinion, and both companies' own pages say no single vendor evaluation should settle purchasing decisions.
Gartner's Hype Cycle is its other famous artifact. It plots technology trends, the adoption and evolution of new technologies, from the Innovation Trigger to the Plateau of Productivity, and the page says "The Hype Cycle research is reserved for paying clients." Forrester covers emerging trends and market trends inside Forrester Decisions, which its 10-K lists as carrying future trends, predictions and market forecasts.
↑ COMPARISONWhat analysts do for buyers: inquiry, data and advisory services
Both companies sell advisory services through one channel, analysts who take calls. Gartner's G-Cloud listings bundle core research, IT Key Metrics Data, peer networking, analyst inquiry, webinars and phone support into one seat. Forrester Decisions, per its 10-K, packs future trends, consumer and buyer data, benchmarking data, best-practice tools and vendor evaluations into what the filing calls its "primary subscription research service".
The analysts and their insights are the product, and they're sized differently. A Gartner inquiry with analysts runs in 30-minute slots, each focused on one question. Forrester's G-Cloud listing promises "Unlimited Analyst Inquiry with the Forrester Analysts" plus "Unlimited Webinars". Buyers developing a shortlist get more from either firm's analysts when they arrive prepared with their target customers and the data behind each requirement.
Market trends coverage differs in breadth. Gartner's GSA list prices seats for sales, supply chain, finance, HR, marketing and security leaders, so organizations can buy Gartner insights for most of their functions, and an industry variant exists for Executive Programs teams. Forrester's research is focused on fewer areas: technology and innovation, customer experience, B2B marketing, and security & risk, the themes of its events in three regions of the world.
Analysts shape industry trends from the vendor side too. Gartner's vendor briefings page offers sessions "typically 45 minutes in length with 1-2 analysts" at no charge. Forrester gives vendors three weeks to answer a Wave questionnaire and a chance to comment on factual errors in their scorecard. That influence runs both ways: analyst reports move vendor sales pipelines, so vendors build analyst relations strategies to influence the buyers who read them.
↑ COMPARISONGartner vs Forrester pricing: what a seat costs on public records
Neither company posts a commercial price list, so the comparable data comes from government procurement records and Vendr's tracked contracts. The UK's G-Cloud marketplace lists both companies, the closest like-for-like reading buyers can get.
| Seat | Annual list price | Source |
|---|---|---|
| Forrester Decisions, Team Access | £12,350 | G-Cloud 13 |
| Gartner Enterprise IT Leadership Team, Role Team Member | £9,900 | G-Cloud 14 |
| Gartner Enterprise IT Leadership Team, Advisor Team Member | £24,100 | G-Cloud 14 |
| Forrester Decisions Research and Advisory Leader, Technology Architecture and Delivery | £36,161.75 | G-Cloud 13 |
| Gartner Enterprise IT Leadership Team Plus, Leader | £64,200 | G-Cloud 14 |
| Gartner for IT Leaders, Advisor (US federal) | $49,576 | GSA 47QTCA18D008L |
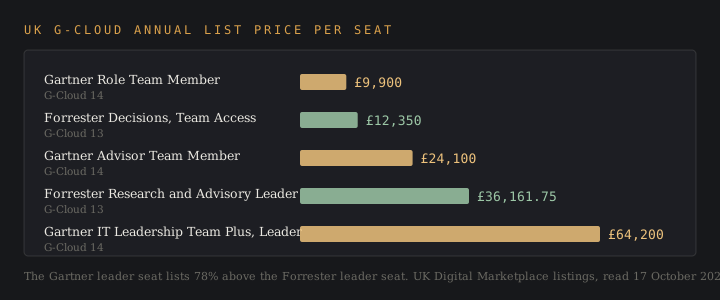
A Forrester leader seat lists at £36,161.75 against £64,200 for Gartner's IT leadership team leader, so the Gartner seat costs 78% more on the UK record. Forrester's customers on that seat get one Forum ticket and a customer success manager, and the Gartner Advisor Team Member listing adds peer networking and an IT Summit ticket. Gartner's inquiry policy caps document review at 20 pages, and its analysts won't comment line by line on a vendor's pricing.
Commercial buyers pay in the same range, per Vendr's contract data. Vendr tracks a $76,002 median Gartner contract across 149 purchases, with a $27,126 low and $289,667 high, read 6 October 2026. Vendr's Forrester page shows a $64,240 median across 67 purchases, from $25,444 to $173,860, read 17 October 2026. The $11,762 gap between medians is a drop in the bucket next to the spread inside each vendor's own range.
Gartner's full US rate card is in our Gartner pricing report, which runs from a $33,346 Reference seat to a $240,600 Global CIO Team Plus leader. Our market research cost report sets both companies against 25 other research vendors.
↑ COMPARISONContract terms, conferences and what it costs to leave
Both companies bill a year up front. Gartner's terms make a seat easy to add and hard for buyers to cut, and Forrester's 10-K describes research contracts of "generally 12 or 24-month periods", typically paid in advance.
- Gartner open-market items are "Non-cancelable and may be terminated only for material breach", per the GSA schedule.
- Gartner group licenses "must be coterminous", so every seat in a team renews on one date.
- 77% of Gartner contracts were multi-year at 31 December 2025, per the 10-K.
- Forrester prices annual subscriptions as "principally a function of the number of licensed users", per its 10-K.
Cutting a Gartner seat mid-term is easier said than done. The renewal date is the one moment to drop a seat, and Gartner CEO Gene Hall described retention loss on the Q4 2025 call as customers trimming seats, a 10-seat client dropping to nine. Standard procurement practices apply: run a usage review 90 days before that date and count calls with analysts per seat.
Gartner's conferences revenue rose 15.5% to $244.2 million in Q2 2026. Forrester's events revenue for all of 2025 was $13.1 million, down 29%. Attending conferences is a real line in a Gartner budget, at $8,200 for an IT Symposium/Xpo pass in Orlando, and close to a footnote in a Forrester one.
↑ COMPARISONFinancial condition: layoffs, impairments and a stock that halved
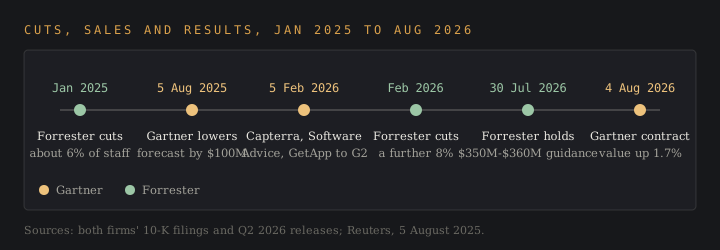
Forrester is between a rock and a hard place. Its 10-K records a cut of about 6% of the workforce announced in January 2025 and another of about 8% announced in February 2026, goodwill impairments of $110.7 million across 2025, and a net loss equal to 30.1% of revenue. CEO George Colony owns about 39% of the stock.
Gartner's trouble is milder. Its stock lost 47.9% in 2025, according to The Motley Fool, which cited federal cost cuts and IT budgets moving to AI adoption. Gartner cut its revenue forecast for Insights, its renamed research segment, by $100 million on 5 August 2025, Reuters reported, and the 10-K says US federal revenue fell about $58 million in 2025. Contract value growth has since resumed at 1.7%, and Insights revenue rose 2.1% to $1,289.8 million in Q2 2026.
- Jan 2025: Forrester announces a cut of about 6% of its workforce.
- 5 Aug 2025: Gartner lowers its revenue forecast by $100 million.
- 5 Feb 2026: Gartner closes the sale of Capterra, Software Advice and GetApp to G2.
- Feb 2026: Forrester announces a further cut of about 8%.
- 30 Jul 2026: Forrester reports Q2 results and holds 2026 guidance at $350 million to $360 million.
- 4 Aug 2026: Gartner reports contract value growth of 1.7%.
For buyers, Forrester's falling demand is leverage. A research company with 87% wallet retention and falling contract value has every reason to hold a renewal, and procurement teams can bring that to the table with Vendr's medians. Renewal strategies for both firms start from the same three numbers: the public list price, Vendr's median and the seat count in real use.
↑ COMPARISONArtificial intelligence and the shift in the analyst landscape
Gartner, Forrester and the other analyst firms now sell AI tools on top of their libraries of reports. Gartner advertises the AskGartner AI tool for its research insights on its client page. Forrester AI, launched as Izola in October 2023, "allows our clients to query our research database", per the 10-K, and the Q2 2026 release says Forrester is developing further products after its Microsoft Teams and Copilot integration work.
Forrester's 10-K names Google and AI services as free alternatives competing for the industry's research demand, next to marketing agencies, consulting firms and survey-based market research companies. Among the trends in the analyst landscape, the role of analysts is shifting from sole authority to one input among several, and the AI tools keep analysts in the loop while charging for human access. Both products bet that buyers will pair AI tools with human analysis.
↑ COMPARISONWhere each one wins, by buyer type
Gartner calls the shots among IT buyers at large enterprises. Its IT leaders page claims 510,000+ client interactions, and its quadrant list covers the software solutions a CIO shortlists. Gartner insights support IT and business planning, sourcing, market analysis and enterprise market strategy.
- CIO or IT buyers running a vendor shortlist: Gartner, for the widest quadrant coverage and analyst access on named vendors.
- CX, B2B marketing or digital transformation team: Forrester, whose events, consulting and customer feedback in the Wave are built around customers and business outcomes.
- Finance or data and analytics team modelling the business case for a technology investment: Forrester's Total Economic Impact method, which scores business value through cost, benefits, flexibility and risk.
Vendor companies work the other side of the table, and their pain points differ. A cybersecurity startup developing its market strategy around a Magic Quadrant spot can brief Gartner analysts for free. Quoting the graphic in sales material means paying for a reprint under Gartner's content compliance policy, and those reprints are the free Gartner reports buyers download from vendor sites.
Forrester's TEI reports are commissioned and done by the book. Each one is marked "commissioned", and Forrester says clients "cannot purchase favorable opinions or results".
Two vendors sued Gartner over their placement. ZL Technologies' 2009 case was dismissed in 2010, and the Connecticut Supreme Court ruled for Gartner against NetScout in January 2020, calling the ratings "nonactionable expressions of opinion". Courts gave Gartner the benefit of the doubt both times.
Gartner's Ombuds FAQ puts its position in one sentence:
Influence over content or the amount of research coverage focused on any vendor, sector or topic is not, and has never been, for sale by Gartner.
Vendors working closely with analysts as trusted advisors should treat the court rulings as the legal status of every rating, from either company.
The third option: IDC, Gartner Peer Insights and competitive intelligence tools
The closest alternative to both is IDC, which Vendr tracks at a $68,870 median contract, between Forrester and Gartner. Gartner, Forrester and IDC sell the same industry product, subscription research with analyst access, and Info-Tech Research Group is the fourth name buyers set against Gartner. In the real world, plenty of companies buy cheaper market data:
- Gartner Peer Insights reviews are free to read and stayed with Gartner after the G2 sale. G2 is covered in our G2 review, and the Capterra side in our Capterra legitimacy report.
- Search tools such as AlphaSense sell analyst reports, filings and transcript data at an $18,375 Vendr median, priced in our AlphaSense pricing breakdown.
- Expert networks bill per call, a model our expert network cost report prices.
- Competitive intelligence solutions track rivals' pricing, launches and market trends every day; our competitive intelligence tools ranking compares 10 of them.
Market analysis from a subscription firm and primary market research answer different questions, a split covered in our guide to market intelligence vs market research. Self-serve solutions with analytics and no analyst on the other end are in our market research tools ranking.
Forrester vs Gartner FAQ
Who is better, Gartner or Forrester?
Gartner is better for enterprise IT buyers running vendor selection, with 143 published quadrants and 2,400+ analysts. Forrester is better value for CX and marketing insights, with a UK leader seat listed at £36,161.75 against Gartner's £64,200.
Who is Gartner's biggest competitor?
Among analyst firms, Forrester and IDC sell the closest research subscriptions. Vendr's medians are $76,002 for Gartner, $68,870 for IDC and $64,240 for Forrester.
Who are Forrester's main competitors?
Forrester's 10-K names Gartner as a principal direct competitor among analyst firms, plus marketing agencies, consulting firms, survey-based market research companies, and free sources such as Google and AI services.
Why is Gartner dropping?
Gartner stock lost 47.9% in 2025 after a $100 million forecast cut, about $58 million less federal revenue, and 1,085 fewer technology client enterprises over 18 months.
What is Gartner known for?
Gartner is known for the Gartner Magic Quadrant, the Hype Cycle and Gartner Peer Insights, plus its IT Symposium/Xpo conferences and analyst reports.
What kind of company is Forrester?
Forrester Research is a publicly listed research and advisory firm with 1,474 employees, selling Forrester Decisions subscriptions covering trends, buyer data and Wave scorecards, plus consulting and events, to 1,797 customers in about 68 countries around the world.
↑ COMPARISONVerdict: which analyst firm to buy
Buy Gartner when the decision is an enterprise technology purchase a board will question. The Magic Quadrant coverage, 2,400+ analysts and 13,000 enterprise customers around the world are what the higher seat price pays for. Bite the bullet on the non-cancelable, coterminous terms and set seat counts before the renewal date.
Buy Forrester when the work is focused on customer experience, B2B marketing or ROI modelling, and when unlimited access to analysts on one seat beats library breadth. Buyers should read its 2025 losses and two rounds of layoffs as leverage, and ask for a 12-month term while revenue guidance points down.