Self-driving car statistics 2026: crashes, safety data and adoption
 By Jan Suski. I go deep on every review, checking every number against its source and digging up details other coverage misses, a habit from six years of SEO and link building for tech companies. Bylines at Brand24 and Senuto. How the scoring works.
The numbers Automated driving in the US and worldwide, checked 19 November 2026
A crash count of 1,493 over four years is small next to the 36,640 people killed on US roads in 2025 alone, but counts alone can't show which is safer.
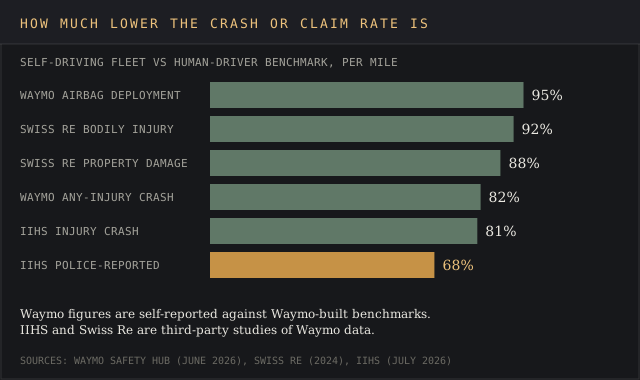
The safety benefits Waymo reports grow with crash severity: 68% fewer police-reportable crashes in the IIHS study, and 95% fewer serious-injury crashes in Waymo's own data.
Driver assistance is mainstream and full autonomy isn't: about half of new vehicles have Level 2, while only about 8,000 robotaxi vehicles operate worldwide.
I'll write a 2,500+ word report on the market you name, with crash data, fleet counts and survey figures linked to their sources. Yours to publish, from $200.
Companies running automated driving systems in self driving cars and other vehicles reported 1,493 unique crashes to the National Highway Traffic Safety Administration between July 2021 and June 2025, according to a February 2026 NHTSA analysis. Over a similar period, Waymo's driverless vehicles logged a police-reportable crash rate 68% lower than human drivers in the same cities, an Insurance Institute for Highway Safety study published in July 2026 found.
This report brings together self driving car statistics from the bodies that collect them: NHTSA's crash reporting order, IIHS, peer-reviewed studies, the International Energy Agency, the operators' own safety hubs and consumer surveys. It covers self driving car accidents, crash rates against human drivers, who is struck and who strikes, robotaxi fleets, Level 2 adoption, public opinion and state laws.
It's for analysts, insurers, city planners, reporters and road users weighing the claim that self driving cars are safer. Raw counts of self driving car accidents miss the mark without miles driven, so each figure below names its source, its period and what it counts.
Self driving car accidents: what NHTSA crash reporting shows
NHTSA's Standing General Order, issued in June 2021, requires companies that build or operate self driving vehicles and Level 2 driver assistance to report crashes on public roads. It's the main data collection for autonomous vehicle accidents and autonomous vehicle incidents in the US, covering self driving cars, automated vehicles and ADAS vehicles.
Accidents involving automated driving systems must be reported in more cases than advanced driver assistance systems, because automated driving systems handle the entire driving task.
NHTSA's own data analysis of those reported crashes, presented in February 2026, counted 1,493 unique crashes where an automated driving system was engaged in the 30 seconds before impact, from July 2021 through June 2025. Light vehicles, mostly robotaxis and self driving cars, accounted for 1,437 of them, heavy trucks 37, shuttles 15 and Level 3 prototypes 4.
| Year | Light-vehicle ADS crashes reported |
|---|---|
| 2021 (from July) | 65 |
| 2022 | 148 |
| 2023 | 295 |
| 2024 | 495 |
| 2025 (January to June) | 434 |
Copy these lines into an email, fill them in and send. I reply with scope and a price within 2 to 3 business days.
Open the email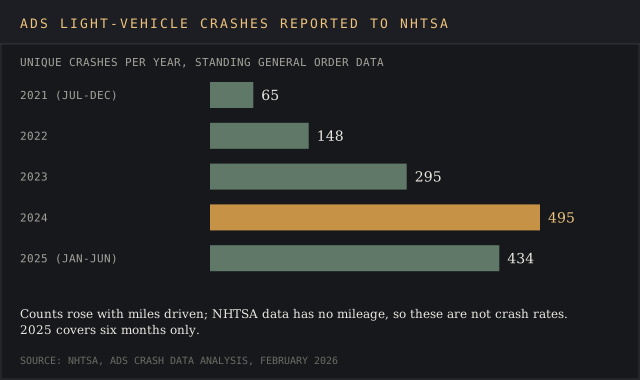
More accidents in the count isn't a sign of less safety here. The count rose because more ADS equipped vehicles and self driving vehicles drove more miles: Waymo alone ran about 500,000 paid rides a week in 2026, up from 50,000 in May 2024. A rising count of self driving car accidents with a falling rate per million miles is what any analysis of autonomous vehicles needs to separate.
Rear-end crashes were the most common type, 31% of the light-vehicle total, followed by angle crashes at 21% and same-direction sideswipes at 20%. In the two crash types where NHTSA split who hit whom, the ADS vehicle was usually the one struck: 94% of same-direction angle and sideswipe crashes and 95% of backing crashes.
Most of these autonomous vehicles had no safety driver, so the system was handling the whole driving task. In backing crashes, 168 of 201 involved an ADS vehicle with no safety driver aboard, and in same-direction angle and sideswipe crashes the figure was 242 of 303. Where the vehicle hit something head-on, 77% of the 144 frontal crashes involved a stationary object, 15% a pedestrian or animal and 8% a parked vehicle.
Are self driving cars safer? Five studies that measure it differently
Are self driving cars safer than human drivers? The answer depends on what's counted: every contact, police-reportable crashes, injury crashes or insurance claims. The five studies of self driving car accidents below use different methods and reach different answers, so each one should be quoted with its method.
| Study | What it compared | Result | Date |
|---|---|---|---|
| University of Michigan Transportation Research Institute | Test vehicles from Google, Delphi and Audi against 2013 national crash rates | 9.1 crashes per million miles against 4.1 for conventional vehicles; no self-driving car at fault | October 2015 |
| Abdel-Aty and Ding, Nature Communications | 2,100 ADS and ADAS crashes against 35,113 human crashes in matched scenarios | Lower odds in most scenarios; 5.25 times higher at dawn or dusk and 1.98 times higher when turning | June 2024 |
| Swiss Re with Waymo | Liability claims over 25.3 million driverless miles | 88% fewer property damage claims and 92% fewer bodily injury claims | December 2024 |
| IIHS | Police-reportable crashes over about 50 million Waymo driverless miles against about 222 billion human miles | 68% lower crash rate overall; 81% fewer injury crashes | July 2026 |
| Waymo safety hub | 271.3 million rider-only miles against human benchmarks in the same cities | 82% fewer injury crashes; 95% fewer serious-injury crashes | Data through June 2026 |
Want a safety comparison chart like this for your own fleet or region? Send the operators and the years.
Email a briefThe 2015 University of Michigan study of self driving vehicles is the source of the widely repeated "9.1 against 4.1 crashes per million miles" figure. It covered just 11 crashes and about 1.2 million miles of testing, the self-driving cars were at fault in none of them, and the injuries were minor injuries, lead author Brandon Schoettle told NBC News.
It's a decade old and describes test vehicles, so robotaxis and the autonomous vehicles of 2026 need newer data.
The Nature Communications study by Mohamed Abdel-Aty and Shengxuan Ding of the University of Central Florida used California crash data from 2016 to 2022. Autonomous vehicles with advanced driving systems had lower odds of a crash than human driven vehicles in most matched scenarios, and rear-end collisions and sideswipes were 0.5 and 0.2 times as common. Dawn or dusk and turns were the weak spots, at 5.25 and 1.98 times the human odds, per The Register.
Insurance claims are a cleaner measure of fault for autonomous vehicles. In the Swiss Re study, Waymo vehicles produced nine property damage claims and two bodily injury claims over 25.3 million miles. Against newer human-driven vehicles with modern safety features, the reductions were still 86% and 90%.
IIHS, an insurer-funded research group, gives the most independent read on how much safer self driving cars are. Its researchers removed duplicate and non-crash reports from NHTSA data, which cut about a quarter of the records, then compared 159 police-reportable crashes with human crash rates in the same places. Waymo's rate was 76% lower in Phoenix, 71% lower in Los Angeles and 35% lower in San Francisco. In Austin it was 4% higher, on a small sample.
Waymo safety data: 271 million driverless miles
Waymo publishes the largest dataset of any operator of autonomous vehicles, straight from the horse's mouth. Through June 2026, its autonomous vehicles drove 271.3 million rider-only miles with no one in the driver's seat: 92.1 million in Phoenix, 82.4 million in the San Francisco Bay Area, 67.1 million in Los Angeles, 21.1 million in Austin and 8.6 million in Atlanta.
| Crash outcome | Reduction against human benchmark |
|---|---|
| Serious injury or worse | 95% |
| Airbag deployment in the Waymo vehicle | 95% |
| Pedestrian injury crashes | 93% |
| Cyclist injury crashes | 86% |
| Any injury reported | 82% |
| Motorcycle injury crashes | 82% |
| Airbag deployment in any vehicle | 82% |
- The operators, region or metrics to cover
- Regions, years and segments
- Where it runs: blog, white-label, gated or lead magnet
- Whose byline goes on it
- Deadline
- 2,500+ words, human-written
- Every figure linked to its source
- Yours to publish, under your name or none
- Hosting here for +$200, with your sponsored links
By crash type, Waymo's autonomous vehicles had 96% fewer intersection injury crashes and 97% fewer single-vehicle injury crashes. Front-to-rear crashes improved least, at 48%, because many are human drivers in other vehicles hitting a stopped Waymo from behind. Waymo calculates that, against the benchmark, its self driving cars avoided 841 injury-causing crashes and 55 serious-injury crashes.
These are Waymo's own figures for its self driving cars against benchmarks Waymo built from public crash data on human drivers. IIHS and Swiss Re point the same way with independent methods, which is the main reason to treat the direction as solid. Waymo's self driving vehicles operate in mapped cities with geofences, such as San Francisco, so the results describe city driving and not every road.
The scale of self driving cars and autonomous vehicles on public roads is growing fast. Waymo reported about 500,000 paid rides a week across 10 US cities in March 2026, up from 250,000 in April 2025, per InsideEVs, and it is targeting 1 million a week by the end of 2026.
Tesla vehicles, Level 2 driver assistance and ADAS vehicles
Most "self driving" crash headlines involve advanced driver assistance systems, the Level 2 kind, and only a minority involve automated driving systems. Level 2 advanced driver assistance systems such as Tesla's Autopilot and Full Self-Driving (Supervised) steer, brake and accelerate, but the human drivers must remain engaged and stay fully responsible for the driving task. NHTSA's reporting order covers these ADAS vehicles too, with lighter reporting rules.
Level 2 reported crashes can't be turned into crash rates for these vehicles, and reading them as rates is barking up the wrong tree. Carmakers with connected vehicles learn about more crashes than those without, so counts reflect data collection as much as safety. Tesla vehicles send telematics data after many crashes, which raises their reported count against brands that rely on customer reports, as TechCrunch noted when NHTSA first released the data.
Tesla's robotaxi service in Austin runs under the ADS rules. Tesla reported 14 incidents involving its Robotaxi fleet from its June 2025 launch through early 2026, per Electrek's tracking of NHTSA data. The fleet is small, so its crash rate swings with each report.
Tesla reported 14 incidents involving its Robotaxi fleet from its June 2025 launch through early 2026, per Electrek's tracking of NHTSA data.
Incidents Tesla reported for its Robotaxi fleet, June 2025 to early 2026
Source: Electrek, from NHTSA datae.g. incident counts for the fleets in your city
Source: linked, checked, datedThe automated features and advanced driver assistance in ordinary vehicles are now common. The International Energy Agency found around half of new cars sold worldwide in 2025 had Level 2 systems that automate steering and speed, up from under 1% about ten years earlier. Hands-free Level 2+ systems reached 10% of sales in China and 6% in the US.
Autonomous vehicle accidents by type: key findings from the data analysis
Key findings from NHTSA's ADS vehicle incident data, read alongside the IIHS and Nature studies, describe what most ADS vehicle accidents look like. Autonomous vehicles get hit far more often than they hit other vehicles, and the typical crash is a low-speed contact in city traffic.
Rear-end collisions lead the list of self driving car accidents, which is par for the course in stop-and-go city traffic.
At 31% of light-vehicle ADS crashes, being rear-ended is the most common way automated vehicles end up in reported crashes. Schoettle, the University of Michigan researcher, told GovTech in 2015 that drivers tend to pass self-driving test vehicles because they drive cautiously, potentially leading to more of these low-speed collisions with human driven cars behind them.
Accidents involving AVs in parking lots and when backing are the next group of AV accidents. Of 201 backing crashes, 191 had the autonomous vehicle struck by another vehicle. Same-direction sideswipes, where a human driver changes lanes into the automated vehicle, follow the same pattern at 94% struck.
Frontal crashes, where the autonomous vehicle hit something, are rarer among self driving car accidents. Of 144 such ADS vehicle accidents, 111 involved a stationary object, 21 a pedestrian or animal and 12 a parked vehicle. Many vehicles in these reports were moving slowly, like most self driving cars in city traffic, and the reports don't record injury severity in NHTSA's summary.
The devil's in the details here, and the data has limits. NHTSA's summary doesn't say how many crashes software failures accounted for, and the reports don't record if hardware or software failures played a role, so no public figure splits AV accidents by technical cause. Various factors, such as road design and other road users' behavior, sit behind every count.
Fatal crashes involving fully driverless vehicles remain rare in the public record of autonomous vehicle accidents. The best known of all self driving car accidents, a 2018 Uber test vehicle that killed a pedestrian in Tempe, Arizona, had a safety driver aboard.
How many vehicles today have self driving technology
Self driving technology now reaches buyers mostly as automated features in ordinary motor vehicles, and in nearly every car on sale the driving task stays with the human. Around half of new vehicles sold worldwide in 2025 had Level 2 systems, the IEA found, and Cox Automotive found 34% of US consumers own a vehicle with Level 2 or Level 3 automation, up from 12% in 2016.
Fully automated vehicles are a different market. About 8,000 robotaxi vehicles operated worldwide in 2025, a drop in the bucket next to the human driven vehicles and motor vehicles on the road. Full automation, Level 5, isn't on sale anywhere, and the IEA reports carmakers are pulling back from Level 3 in privately owned vehicles.
Autonomous technology spreads fastest where safety features already sell. Automatic emergency braking, lane keeping and adaptive cruise control are the building blocks of Level 2, and Waymo vehicles still had 86% fewer property damage claims than Swiss Re's group of newer human-driven vehicles with those safety features. Even experienced drivers with those systems still make the errors the systems were built to catch.
For consumers buying vehicles, the practical question is how much of the driving task the vehicle takes over. A Level 2 system can handle steering and speed, yet the driver must keep watching for potential hazards. Only Level 4 robotaxi vehicles take over the entire driving task inside their service area, with no human intervention expected, which is where the safety benefits of autonomous vehicles show up.
Levels of driving automation: from Level 0 to full automation
The industry uses SAE International's six levels, from Level 0 to Level 5. NHTSA's automated vehicle safety page uses the same scale, splitting it into driver support features and automated driving systems.
| Level | Name | Who drives |
|---|---|---|
| 0 | Momentary driver assistance | Human; system warns or briefly intervenes |
| 1 | Driver assistance | Human; system helps with steering or speed |
| 2 | Additional assistance | Human, who must supervise; system steers and controls speed |
| 3 | Conditional automation | System, in limited conditions; human must take manual control when asked |
| 4 | High automation | System, in a defined area or conditions; no human intervention needed |
| 5 | Full automation | System, everywhere a human could drive |
Levels 0 to 2 assist drivers, with advanced driver assistance systems at Level 2; Levels 3 to 5 are automated driving systems that perform the driving task. No Level 5 vehicle is on sale, and Level 3 is shrinking. Mercedes-Benz launched the first Level 3 system, Drive Pilot, in 2021, working at up to 95 km/h on motorways with 10 seconds' warning before the driver retakes control. The IEA reports Mercedes dropped it in an early 2026 model update.
Robotaxis are Level 4 automated vehicles, the autonomous vehicles most people picture. They run without human intervention inside a mapped zone, and purpose-built models such as Zoox's have no steering wheel or pedals at all.
NHTSA's automated vehicle safety page, which supports the safe development of these vehicles, traces vehicle safety from seat belts and antilock brakes to these fully automated systems, and says the agency is dedicated to advancing the lifesaving potential of new vehicle technologies.
Robotaxi statistics: fleets, cities and growth
The robotaxi fleet of autonomous vehicles is small but doubling, and these vehicles now share city streets with human drivers in more than 20 cities. The IEA counted about 8,000 robotaxi vehicles in 2025, more than twice the year before, operating commercially in around 20 cities, mainly in China and the US, with Dubai and Abu Dhabi also running services. It projects 700,000 to 3 million robotaxi vehicles by 2035, concentrated in 40 to 80 cities.
Costs for autonomous vehicles are falling, and they're worth keeping an eye on. Waymo's first robotaxi used 40 sensors and cost over $100,000; it has since cut the vehicle cost to around $70,000, and Baidu's Apollo RT6 costs under $30,000 to build, per the IEA.
Waymo leads among US autonomous vehicles. It ran about 4,000 vehicles across 15 US cities by September 2026, per a TechCrunch fleet count, with San Francisco, Phoenix and Los Angeles its largest markets by miles. Autonomous trucks, the heavy vehicles of the sector, began commercial operation largely under the radar on US public roads in 2025, and the IEA expects up to a quarter of hub-to-hub truck sales in the US, Europe and China to be autonomous by 2035.
Self driving car safety in context: human drivers and US road deaths
The benchmark for self driving cars is grim, and it's the elephant in the room in every safety debate. NHTSA's early estimate puts US traffic deaths at 36,640 in 2025, down 6.7% from 39,254 in 2024. Human errors sit behind most crashes: in NHTSA's crash causation survey, the critical reason for the crash was assigned to the driver in 94% of cases.
That 94% figure is often misquoted as "human error causes 94% of crashes." NHTSA's 2015 Crash Stats note says the critical reason is the last event in the causal chain, and it isn't intended as the cause of the crash or an assignment of fault. Road design, weather and vehicle defects contribute to many of those crashes as well.
Self driving vehicles and other automated vehicles, autonomous vehicles included, remove some human errors, such as drunk or distracted driving, and add new failure modes, such as software misreading a scene, which is why AV accidents still happen. That makes autonomous vehicle safety a public health question as much as an engineering one, since the safety risks change shape as automation grows.
Public health gains need scale. Even at Waymo's pace, autonomous vehicles drive a tiny share of total US driving, so their effect on national road deaths isn't yet measurable.
Public opinion on self driving cars
Americans are warming to autonomous vehicles, automated vehicles and self driving cars slowly, and plenty are still on the fence. The 2026 Cox Automotive Autonomous Vehicle Study, fielded online in May 2026 with 2,135 US consumers, found familiarity with AV technology rose to 58% from 40% in 2016, and ownership of Level 2 or Level 3 vehicles rose to 34% from 12%.
| Cox Automotive 2026 finding | Share of consumers |
|---|---|
| Familiar with autonomous vehicle technology | 58% |
| Open to riding in a robotaxi | 55% |
| Expect fully autonomous vehicles in their lifetime | 46% |
| Own a Level 2 or Level 3 vehicle | 34% |
| Have ridden in a robotaxi | 18% |
| Want a fully driverless Level 5 vehicle | 10% |
Actions speak louder than words here. Experience moves opinion, and the vast majority of riders came away more positive. In cities with Waymo or Zoox service, 33% of residents had ridden in a robotaxi, and 83% of riders said the ride improved their view of AVs, per Repairer Driven News. Among people who hadn't ridden, 61% named discomfort with having no human driver as the main barrier.
Consumers want automated vehicles with a safety net, and most won't jump on the bandwagon without proof of safe operation. Only 10% want a fully driverless Level 5 vehicle, down from 17% in 2016, while 57% would pick Level 3 or higher vehicles for their next purchase if every level were on sale.
Who is liable in autonomous vehicle accidents
Liability for AV accidents follows the level, which decides who has to face the music after a crash. In Level 2 vehicles the human driver is fully responsible, because the system only assists drivers. In a Level 4 robotaxi with no one at the wheel, the AV company operating the self driving car carries the responsibility for the driving, which is why Waymo's insurance claims can be compared with human drivers' claims at all.
State laws decide the details. California's DMV issues separate driverless testing and deployment permits and can restrict, suspend or revoke them. A personal injury law firm reviewing an autonomous vehicle crash will start from those state laws and NHTSA's reports on accidents involving AVs and other vehicles.
Police stops follow state rules too. Since July 1, 2026, California's AB 1777 lets police issue a notice of autonomous vehicle noncompliance to the manufacturer when a driverless car breaks a traffic rule, since there's no driver to ticket. The manufacturer must report each notice to the DMV.
Delivered for your site and your byline. Hosting here is optional.
Frequently asked questions
What percentage of cars are self-driving?
Almost no vehicles today are fully self-driving. About 8,000 robotaxi vehicles operated worldwide in 2025, per the IEA, against hundreds of millions of vehicles on US roads alone. Around half of new vehicles sold worldwide in 2025 had Level 2 driver assistance, which still needs a human driver.
Have there been any accidents with self-driving cars?
Yes. Self driving cars and other autonomous vehicles have been in thousands of reported crashes, most of them minor. NHTSA's analysis counted 1,493 crashes involving automated driving systems from July 2021 to June 2025, and ADS equipped vehicles were usually struck by human driven cars. Tesla's Austin robotaxi vehicles reported 14 incidents in their first months, per Electrek.
Do self-driving cars have a higher rate of accidents?
The newer data says no. The 2015 University of Michigan study found 9.1 crashes per million miles for self driving test vehicles against 4.1 for conventional vehicles, on just 11 crashes. Larger studies of Waymo vehicles since then, by IIHS and Swiss Re, find fewer crashes per mile than human drivers, with more accidents only in specific conditions such as dawn, dusk and turns.
Are self-driving cars statistically safer?
For Waymo vehicles, the best data says self driving cars are safer than human drivers in the cities it serves. IIHS found a 68% lower police-reportable crash rate, Swiss Re found 92% fewer bodily injury claims, and Waymo's own data shows 95% fewer serious-injury crashes. The Nature Communications study found higher odds at dawn, dusk and in turns.
How many times have self-driving cars crashed?
NHTSA counted 1,493 unique autonomous vehicle crashes involving an engaged automated driving system from July 2021 through June 2025. In most crash types where NHTSA split fault, the ADS vehicle was the one struck, and the autonomous vehicle accidents mostly caused minor injuries or none.
Are there more accidents with driverless cars?
Reported crashes of driverless cars and other autonomous vehicles are rising because driverless miles are rising. Per mile, IIHS found the police-reportable crash rate for Waymo's self driving cars was 68% lower than human drivers in the same cities.
What are 90% of car accidents caused by?
The often-quoted figure is NHTSA's 94%: in a 2005 to 2007 survey, the critical reason for the crash was assigned to the driver in 94% of cases. NHTSA says that's the last event in the causal chain, and other factors usually contribute.
Can a cop pull over a Waymo car?
Police can stop a Waymo and deal with its remote operator. In California, since July 1, 2026, police can send a notice of noncompliance to the AV company when a driverless car breaks a traffic rule.
Bottom line
In a nutshell, self driving car statistics point one way once miles are counted, and self driving cars look safer in every mile-based study. NHTSA logged 1,493 ADS crashes from mid-2021 to mid-2025, and the vehicles were usually the ones struck. IIHS, Swiss Re and Waymo's own data all show large reductions against human drivers, rising with crash severity.
The weak spots of self driving cars are known, and the Nature study zeroes in on them: dawn and dusk, turns, and Level 2 systems that rely on a human who has stopped paying attention.
The jury's still out on scale for self driving vehicles and robotaxi operators, who need safe operation at far larger fleet sizes. With about 8,000 robotaxi vehicles worldwide and 36,640 US road deaths in 2025, self driving cars aren't yet big enough to move the national numbers.
Carmakers, insurers and mobility startups use reports like this one in investor decks and client briefs.
A report on your topic for a blog page, gated content or a lead magnet.
Written for your client and published under their brand, with my name left off.
Your report on marketintelligencetools.com, with 2 to 3 CTAs carrying your sponsored links.
Default terms: the report is yours to publish, and I keep the right to republish it on this site behind a gate, outside Google's index.
The crash data, studies and surveys behind each self-driving figure, and the mileage NHTSA never collects
Government: nhtsa.gov (ADS crash scenario analysis, February 2026; automated vehicle safety page), crashstats.nhtsa.dot.gov (2025 early fatality estimate and the 2015 Crash Stats note, DOT HS 812 115) and dmv.ca.gov (AVIM 2026-002, AB 1777 notice). Research: iihs.org (July 2026 Waymo study), iea.org (autonomous vehicles report), Nature Communications via theregister.com (June 2024) and nbcnews.com (University of Michigan study, October 2015).
Operators and surveys: waymo.com (safety impact hub, data through June 2026; Swiss Re study, December 2024), coxautoinc.com (2026 Autonomous Vehicle Study, September 2026), repairerdrivennews.com (6 October 2026), insideevs.com (Waymo rides, 2026), electrek.co (Tesla Robotaxi incidents, February 2026) and techcrunch.com (NHTSA data release coverage).
All figures checked 19 November 2026. NHTSA's crash reports carry no mileage, so no regulator publishes a crash rate per mile for automated vehicles; every rate on this page comes from IIHS, Swiss Re or Waymo.