Geographic segmentation: choosing the unit, the data and the limits
 By Jan Suski. I go deep on every review, checking every number against its source and digging up details other coverage misses, a habit from six years of SEO and link building for tech companies. Bylines at Surfer, Brand24, and Senuto. How the scoring works.
The short version 13 points · 50 seconds
- 01Geographic segmentation groups buyers by placeLocation, density, climate and culture
- 02Geography decides where the budget goesMedia, mail, stores and reps buy by region
- 03The unit you aggregate to changes the segmentsState, metro, ZIP Code and block group differ
- 04ZIP Codes are delivery points that driftCensus publishes ZCTAs as the mappable unit
- 05The core U.S. geographic data is freeACS 5-year tables and USDA RUCA codes
- 06The urban threshold doubled in the 2020 rules1,140 places moved from urban to rural
- 07Climate segments need a refresh dateHalf the country moved a half zone in 2023
- 08Language and local tastes change the productMcDonald's builds menu items per country
- 09Geography sets price as well as productNetflix cut prices in 116 more countries
- 10A geographic build runs in six stepsFrom geocoded list to holdout-tested segment
- 11Area averages mislead about individualsRobinson: .53 across states, -.11 across people
- 12Neighborhood segments carry legal riskCity National paid over $31 million in 2023
- 13A segment earns budget only against a holdoutOne metric per segment, chosen before launch
Geographic segmentation divides a market by where customers live, work or buy: country, region, metro area, ZIP Code, density class or climate zone. This lesson is for marketers and analysts who already hold a customer list with addresses. It covers how to choose the geographic unit, which free public dataset feeds each variable, and where geography-only segments break.
The choice matters because the inputs move. The Census Bureau's 2020 rules dropped 1,140 places from urban to rural, and a bank paid over $31 million in 2023 over how it drew neighborhood lines. Local markets, language and local prices all get a section, and geographic segmentation in marketing gets a six-step build.
If the five bases are new, start with the market segmentation overview first. Geographic is the oldest of the five and usually the cheapest, because governments publish most of the data for free.
What geographic segmentation is, and the four variables it runs on
Geographic segmentation in marketing sorts potential customers by physical location and by the traits that come with a place. Geographic segmentation works on two layers at once. The customer's location is the input. The segment is the group of places that share a trait worth planning around, like cold winters, high population density or a dominant language.
Every geographic variable falls into one of four families, and these geographic segmentation variables are the same ones every guide lists. Places in different regions with matching variables can share a segment. What differs is the data. Each family answers a different planning question, and each has its own public source.
Location and administrative region
Country, state, metro area, county and ZIP Code are the coordinates of a geographic segment. They decide where a sales territory starts, which distribution channels can reach a store and which tax or shipping rules apply. A business selling in international markets starts at country level; a regional bank starts at county, and a chain with stores on the West Coast and in the Midwest starts at metro area.
Population density and urban or rural class
Density sorts places into dense cities, suburban areas and rural markets. It changes what people buy and how they get it: ride-hailing only works where enough riders & drivers share the same streets, and a farm-supply store needs the opposite. Suburban customers sit between the two, with car access and larger homes.
Climate and weather patterns
Climate patterns decide seasonal demand for heating, cooling, outerwear, lawn care and insurance. Insulated jackets belong in colder regions; sunscreen sells all year in warmer ones. Weather patterns are the short-run version, and a retailer reacting to a cold snap is segmenting on weather.
Culture and language
Local culture, local customs and local languages shape which marketing messages land. Cultural differences show up in diet, holidays, humor and attitudes to price. These variables are the hardest to measure and the easiest to get wrong, which is why the language and menu examples further down carry the most detail.
Why businesses use geographic segmentation
Companies use geographic segmentation to decide where marketing efforts and marketing strategies go, because a budget split evenly across a country overpays in thin regions and underpays in dense ones. A target market defined by place is also the easiest to reach: media, mail, stores and sales reps are all bought by geographic area.
The payoff shows up in four places. Marketing campaigns get more relevant when the message, language and timing match the region, and marketing efforts stop leaking into different regions that never convert. Product offerings fit regional preferences, so fewer items sit unsold. Resource allocation improves because marketing activities follow the regions with the most potential customers. And new markets surface when a region's numbers look like the best existing ones.
All four depend on the unit. A target audience or target market defined only by a state line is a guess, and competitive advantage from geographic segmentation comes from finer units and better data than competitors use. The case for any intelligence work, geographic included, is set out in why market intelligence matters; the sections below turn it into specific locations, data files and checks.
Marketing strategies built this way also travel, and marketing campaigns can be copied with them. A market based on climate zone or density class can be copied to various regions that share the same traits, which is how a chain using geographic segmentation picks its next metro: it looks for particular areas whose profile matches the stores that already work. That's the practical difference between segmentation approaches that describe a map and ones that drive a plan.
A business that has geographically segmented its customers once can reuse the segments for pricing, staffing, inventory and regional differences in service hours, a rare case of killing two birds with one stone in marketing research. The hard part is the data, and the next section starts there.
Geographic segmentation starts with the unit, then the variable
The same customer list produces different geographic segments depending on the unit it's aggregated to, because each unit groups places with unique characteristics differently, and those unique characteristics are what a segment is built on.
A state average blends a dense metro core with the rural counties around it. A block group shows that gap but carries a wider margin of error. The unit is the first decision, and most teams make it by accident, using whatever field the CRM happens to store.
| Unit | Published by | Size or count | Works for | Where it breaks |
|---|---|---|---|---|
| Country or world region | National statistics offices | One per country | Market entry, pricing, language | Hides every regional difference inside a border |
| State or province | Census Bureau | 50 states plus DC | Regulation, tax, shipping zones | Mixes metro cores with rural counties |
| Metro or micro area (CBSA) | OMB, via the Census Bureau | 387 metro, 538 micro (July 2023) | Media buying, store networks, sales territories | Omits rural areas outside any core |
| ZIP Code or ZCTA | USPS; ZCTAs by the Census Bureau | ZIP Codes date from 1963 | Direct mail, delivery, CRM joins | ZIP Codes are delivery points, so boundaries drift |
| Census tract | Census Bureau | Used by RUCA codes and ACS tables | Urban or rural flags, income profiles | Needs geocoded addresses to join |
| Block group | Census Bureau | Smallest ACS geography | Site selection, trade areas | Small samples widen the error band |
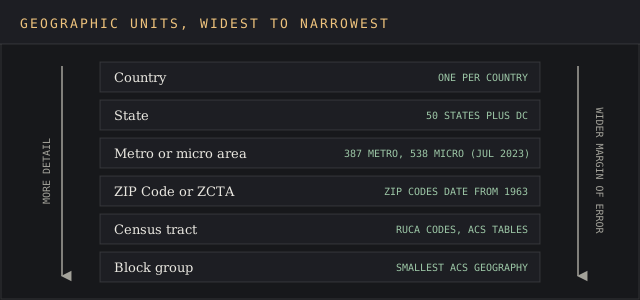
Metro areas are the most useful prebuilt unit. Each metropolitan statistical area must contain an urban area of at least 50,000 people, and each micropolitan area one of 10,000 to 49,999. As of July 2023 there are 387 of the first and 538 of the second. Together they're called core based statistical areas, a term that took effect in 2000.
ZIP Codes are the unit most CRMs store, and the one that misleads most. The Census Bureau's own ZCTA guidance calls ZIP Code data point-based and "unsuitable for mapping and many analysis applications." ZCTAs approximate ZIP delivery areas using 2020 census blocks, but not every valid ZIP Code has a ZCTA. A billing ZIP that maps to nothing is par for the course.
Where the geographic data comes from, and what it costs
Most geographic data for U.S. segments is public, free and published by a handful of federal programs. Commercial location data adds foot traffic and point-of-interest layers, but the base layer costs nothing. That's the reason geography is often the first segmentation a small team runs, and the reason the devil's in the details of which vintage was used.
The American Community Survey supplies income, age, housing and commute tables for every geographic area. Its 1-year estimates cover only areas with 65,000 or more people. The 5-year estimates cover all areas, built from 60 months of data, which makes them the only option for tracts and smaller geographies. Treat ACS as the core of any secondary market intelligence on place.
The USDA's Rural-Urban Commuting Area codes classify every census tract and ZIP Code by urbanization and commuting ties. The 2020 version covers the U.S. and its territories. A December 2025 errata revised population and land-area values for 1,213 of the 61,285 tracts in the file, which is why a segment file should record the download date.
Climate data comes from the USDA's plant hardiness zone map and from NOAA. The census urban-area file adds the density split. Each source has a release date, and a segment built on mixed vintages compares 2010 boundaries with 2020 counts. Logging the source and year for every field is the habit covered in data source attribution techniques.
Population density and the urban-rural split
Population density is the geographic segmentation variable that moves most with policy. On December 29, 2022 the Census Bureau published its 2020 urban areas under new rules. The minimum population for an urban area rose from 2,500 to 5,000, with a new alternative of 2,000 housing units.
The change reclassified 1,140 areas that were urban in 2010 as rural. The urban share of the U.S. population fell to 80.0%, from 80.7%. The Bureau attributes the shift mostly to the new criteria, with little migration behind it. Any segment that flags urban markets and rural markets on 2010 definitions now mislabels those 1,140 places.
Density works as a proxy for how people shop. Dense urban districts mean shorter trips, smaller homes and more delivery. Rural areas mean longer drives, bigger baskets and fewer stores. Suburban areas split the difference. Consumer behavior follows density loosely. Treat these as hypotheses about consumer behavior to test against sales data, since density describes a place and buying habits belong to people.
Climate segments need a calendar as well as a map
Teams that use geographic segmentation on climate learn that climate patterns change product offerings, and the maps that describe them get revised. The USDA updated its plant hardiness zone map on November 15, 2023. It splits the country into 13 zones of 10 degrees Fahrenheit, each halved into 5-degree half zones.
The new map draws on 13,412 weather stations against 7,983 for the 2012 edition, using 30-year averages from 1991 to 2020. About half the country moved into the next warmer half zone. A garden retailer that stocked plants by the 2012 zones would miss the mark on half its locations.
The lesson carries past gardening. Heating, cooling, outerwear and roofing all sell by climate zone, and marketing strategies and marketing campaigns for those categories run on a seasonal calendar per zone. Every one of those zones has a revision date. Put a refresh date on climate-based geographic segments, the same way a price list carries an expiry date, and keep an eye on the next edition.
Language, local tastes and cultural preferences
Language is the geographic variable with the most categories. Even one country holds several: a campaign written for one language region reaches the next region as a translation, and translated jokes rarely survive the trip. Localized advertising uses local languages and cultural references so marketing messages and marketing materials read as written for that market and its local culture.
Ethnologue counts 7,164 languages in use today.
Menus are the plainest record of local tastes. McDonald's runs a rotating menu at its Chicago headquarters restaurant that it described in June 2019 as "new global menu items from India, Sweden, Switzerland, Malaysia and Belgium." India's entry was a Veggie Muffin with a spinach, corn and cheese patty. Sweden's was the Big Tasty beef burger.
Those items exist because one country's diet differs from the next. A product that sells in one particular region and falls flat in another is the plainest sign that cultural preferences are doing the segmenting.
Marketing messages tested in one market before a national launch save the most money. Customer feedback broken out by region is the cheapest way to zero in on regional preferences and cultural nuances before a menu, a pack size or a slogan gets rolled out across different markets.
Pricing by geography
Geographic segmentation decides price as well as product. Purchasing power, local competition and currency all vary by country, and a competitive advantage on price in one market can vanish at the next border, so a single global price is too high in some markets and too low in others. Pricing teams in developing countries face the sharpest version of that trade-off.
Netflix's Q1 2023 shareholder letter shows the trade-off in numbers. After an earlier price cut in India, the company wrote that it "reduced prices in an additional 116 countries in Q1." Those markets "represented less than 5% of our FY'22 revenue." Netflix bet that adoption in those markets would raise revenue over time, a geographic segment defined by price sensitivity.
Smaller companies use geographic segmentation for the same call with less data, and point their marketing efforts and marketing strategies at the regions where a test price held.
Regional price tests, coupons limited to specific regions or a set of specific regions, promotions timed to local events and shipping thresholds set by zone are all geographic pricing, and each one needs a measured baseline from the region before the change.
How to build geographic segments, step by step
An effective geographic segmentation build starts from the customer's location and ends with a tested segment. The steps below assume a customer list with addresses and no paid data. Larger teams run the same steps inside location intelligence platforms.
- Clean the location data and record its data collection date. Standardize addresses and separate billing ZIP from shipping ZIP, since the second is where the product is used.
- Geocode to a point, then assign each point to a ZCTA, tract and metro area.
- Join the public layers: ACS 5-year tables, RUCA code, urban-area flag, hardiness zone and language data.
- Group places into geographic segments by the one or two variables tied to the decision, such as density class and climate zone, so similar markets in different locations land together.
- Add demographic data or behavioral data to each segment, and write down the target audience each one serves. Geography alone rarely explains purchase behavior.
- Test each segment against sales in a holdout region before moving marketing spend.
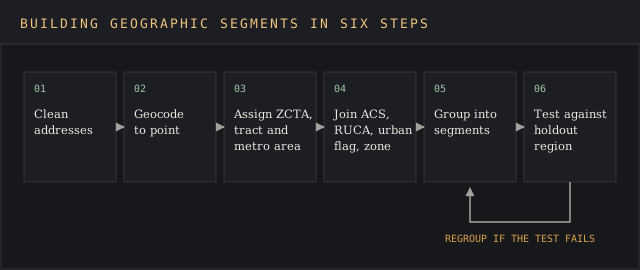
Step four is where most builds go wrong. Teams put all their eggs in one basket by grouping on every available variable at once and end up with 40 segments too small to fund. Two variables and four to six groups is a workable start. The customer segmentation template holds that structure, and sizing each segment tells you which ones justify a budget.
Step five is the reason geographic segmentation sits beside the other bases. Demographic segmentation explains who lives in a place, and behavioral segmentation explains what they do there. Successful geographic segmentation combines location data with both, and the other segmentation methods catch what a map can't. In customer segmentation, geography is one input next to demographic segmentation and behavior.
Where geographic segmentation breaks
The largest failure is reading a place average as a fact about each person in it. Statisticians call it the ecological fallacy. David Freedman's paper on ecological inference retells W.S. Robinson's 1950 example: across the 48 states in 1930, the share of foreign-born residents and the share of literate residents correlated at .53. Computed across individuals, the correlation was -.11.
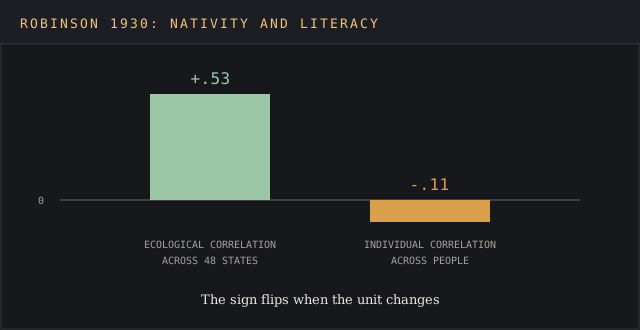
Robinson's sign flipped. A segment built on state averages would have targeted the wrong people. The same risk applies to any ZIP Code profile: a ZIP with high median income still holds households at every income level, and relying solely on the median sends premium offers to people who can't buy them. Every geographic location holds a spread.
Legal exposure is the second geographic segmentation failure. Segmenting by neighborhood becomes redlining when the neighborhoods are defined by race and the product is credit, housing or insurance. In January 2023 the Justice Department secured over $31 million from City National Bank, the largest redlining settlement in its history.
The department alleged that from 2017 through at least 2020 the bank avoided majority-Black and Hispanic neighborhoods in Los Angeles County. Other lenders took in more than six times as many applications there each year. City National opened or acquired 11 branches in 20 years and put one in those neighborhoods. The settlement funds a loan subsidy of at least $29.5 million.
For any team in a regulated category, that case is a red flag. Geographic segments for lending, housing, insurance or hiring should go through legal review, and a segment that tracks racial composition closely needs a business reason written down before it ships.
Staleness is the third failure, and it hits every geographic segmentation example built from old files. Urban boundaries changed in 2022, hardiness zones in 2023, RUCA values in 2025. A segment file without dates on its inputs is a needle in a haystack to audit later.
How to tell a geographic segment is working
A geographic segment earns its place when it changes a result the business already measures. Pick one metric per segment before launch: conversion rate, average order, repeat purchase, customer engagement or customer satisfaction score. Customer satisfaction by region is often the first metric to move.
Then run the segment-specific campaign in some regions and hold out comparable ones in different locations. A target market that converts the same in test and holdout regions isn't a segment yet.
The holdout is the whole test. If outerwear sales in Minnesota rise every October on their own, a fall campaign there proves nothing unless a matched cold region ran without it. Compare against the holdout, then compare the gain from those marketing efforts with the marketing budget spent. A segment that wins on engagement and loses on cost goes back to the drawing board.
Review segments on the calendar the data sets. ACS 5-year tables refresh yearly, so an annual review fits most geographic insights. Tie the results into the wider market intelligence analysis so regional trends show up next to competitor and pricing data.
FAQ
What are geographic variables?
Geographic variables, also called geographic segmentation variables, are the location-based traits a market can be split on, the groups based on place. The four families are location and region, population density, climate, and culture or language. Each has a public source in the U.S., such as ACS tables for income by area and RUCA codes for urban or rural class. A market based on one county's values rarely transfers whole to the next county.
Can you give me an example of geographic data?
A ZIP Code, a metro area name, a latitude and longitude pair, a RUCA code and a hardiness zone are all geographic data. The Census Bureau's ZCTA file is a common example: it turns 1963-era ZIP Code delivery points into mappable areas built from 2020 census blocks.
What is an example of geographic segmentation?
Netflix's 2023 price cuts are one of the plainer geographic segmentation examples. The company lowered prices in an additional 116 countries in Q1 2023, a group of markets worth under 5% of its 2022 revenue, treating price-sensitive countries as one segment. More geographic segmentation examples, with data sources, sit on the market segmentation examples page.
What is geographic market segmentation?
Geographic market segmentation is the same practice as geographic segmentation, applied to a whole market before entry, with no customer list yet. It sizes and groups geographical areas, often at metro or country level, to decide where to sell first. Geographical segmentation is a variant name for the same idea, and geographical segmentation guides use the same four variable families.
How does McDonald's use geographic segmentation?
McDonald's builds menu items for single countries and adjusts them to local tastes. Its Chicago headquarters restaurant served items from India, Sweden, Switzerland, Malaysia and Belgium in 2019, including India's Veggie Muffin and Sweden's Big Tasty.
Which companies use geographic segmentation?
Most companies with physical locations or regional pricing use geographic segmentation in some form. Retailers use it for stock and store placement, banks for branch networks, streaming services for price, and garden centers for planting zones. Banks face the strictest limits, because fair-lending law applies to how neighborhoods are chosen.
What are the four types of market segmentation?
The four classic types are geographic, demographic, psychographic and behavioral segmentation. B2B teams add firmographic segmentation as a fifth. Geographic is the cheapest to start, since most of its data is published free.
Bottom line
Geographic segmentation is only as good as the unit and the vintage behind it. Pick the unit first, join free public data with dates attached, and combine location with demographic and behavioral data before marketing strategies or marketing campaigns move any budget.
Skip those steps and the costs are concrete: segments built on retired urban boundaries, stock planned on a hardiness map half the country has moved off, offers aimed at a ZIP median that describes nobody, and, in lending, a settlement in the tens of millions. The next lesson applies all five bases to named companies in market segmentation examples.