Average 401k balance by age: $167,970 average, $44,115 median in 2026
 By Jan Suski. I go deep on every review, checking every number against its source and digging up details other coverage misses, a habit from six years of SEO and link building for tech companies. Bylines at Brand24 and Senuto. How the scoring works.
The numbers US 401(k) and retirement accounts, checked 19 November 2026
The Vanguard average is 3.8 times the median, so the typical saver holds about a quarter of the headline figure.
Empower's average is 2.4 times Vanguard's because its users are counted across current and former employer plans, and they skew toward engaged savers.
Only 54.9% of US families hold any retirement account, so every 401(k) average already leaves out close to half of households.
I'll write a 2,500+ word report on the savers, plans or age groups you name, with every balance and limit linked to its source. Yours to publish, from $200.
The average 401(k) balance across the 4.6 million participant accounts in plans Vanguard administers reached a record $167,970 at the end of 2025, and the median reached $44,115, according to Vanguard's How America Saves 2026. By age, the average climbs from $7,259 for savers under 25 to $330,186 for those 65 and older, while the median tops out at $107,269 for ages 55 to 64.
Three other publishers measure retirement savings in their own way. Fidelity put its average 401 k balance at $155,800 on 30 June 2026, Empower's dashboard users average $406,242, and the Federal Reserve's 2025 survey puts the median retirement account of families that hold one at $106,000.
This report sets the average 401k balance by age beside the median for each age group, shows why the four sources disagree, and covers savings rates, 2026 contribution limits and Social Security. It's for savers checking where they stand and for anyone quoting these numbers, because the headline average describes few real accounts. In a nutshell, the median is the number most savers should hold themselves against.
Average 401(k) balance by age: Vanguard's 2025 figures
Vanguard publishes the cleanest age breakdown because it counts every participant in the plans it runs, engaged or not. The table below is Figure 53 of How America Saves 2026, with balances as of 31 December 2025. The ratio column is our calculation.
| Age group | Average 401(k) balance | Median 401(k) balance | Average as a multiple of median |
|---|---|---|---|
| Under 25 | $7,259 | $2,234 | 3.2x |
| 25 to 34 | $50,261 | $18,732 | 2.7x |
| 35 to 44 | $120,742 | $46,919 | 2.6x |
| 45 to 54 | $214,991 | $78,730 | 2.7x |
| 55 to 64 | $305,006 | $107,269 | 2.8x |
| 65 and older | $330,186 | $103,202 | 3.2x |
| All participants | $167,970 | $44,115 | 3.8x |
Copy these lines into an email, fill them in and send. I reply with scope and a price within 2 to 3 business days.
Open the email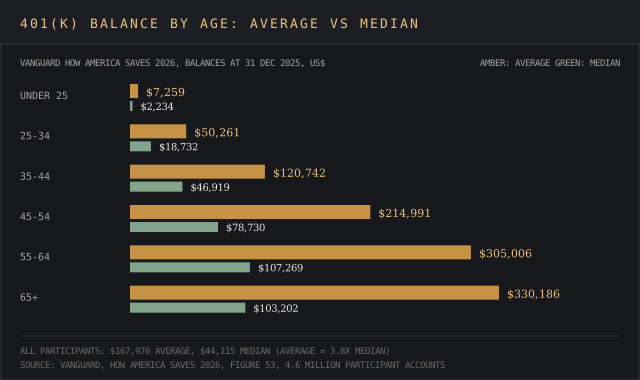
Balances rise for four decades, then stall. The median 401(k) balance at 55 to 64 is 48 times the under-25 median, and it dips 3.8% for the 65-and-older age group (our calculation). That dip is the retirement drawdown showing up in the data: savers past retirement age stop contributing and start withdrawing.
The same age group carries the widest gap at both ends of working life. Young savers have tiny balances, so one rollover from an old job lifts the average. Older savers include the long-tenure, high-income workers whose accounts pull the average far above the median, which is par for the course in any wealth measure.
Average vs median retirement savings: why the gap runs 3.8 to 1
An average adds every balance and divides by the number of savers, so a small share of large accounts drags it up. The median is the midpoint: half of participants hold more and half hold less. Financial planners and the Federal Reserve report both for that reason, and for most readers the median retirement savings figure is the one to compare against.
Vanguard's Figure 51 shows how lopsided the distribution is at the end of 2025:
- 26% of accounts held under $10,000
- 48% held under $40,000 (our sum of the three lowest bands)
- 8% held $100,000 to $149,999
- 18% held $250,000 or more
That top 18% holds the lion's share of the dollars, and it's where the average comes from. Read between the lines and a quarter of accounts would round to zero in most retirement income plans, while nearly one in five holds a quarter of a million dollars or more.
The gap also moved in 2025. Vanguard's average grew 13% from $148,153 and the median grew 16% from $38,176, so the typical account caught up a little with the mean (our calculation from Figure 50). Strong markets lift big balances in dollar terms, and steady contributions lift small ones in percentage terms.
Why the published estimates diverge
Search for the average 401(k) balance and four numbers come back, each from a different set of savers on a different date. Each one is accurate for the savers it counts, and the devil's in the details: a figure only means something next to its sample.
| Publisher | Headline figure | Who is counted | Date |
|---|---|---|---|
| Vanguard | $167,970 average, $44,115 median | 4.6 million participant accounts in about 1,300 plans Vanguard administers | 31 Dec 2025 |
| Fidelity | $155,800 average | 25.8 million active participants with a balance in 27,300 corporate plans | 30 Jun 2026 |
| Empower | $406,242 average | Users of Empower's online financial dashboard, current and former employer plans | Sep 2026 |
| Federal Reserve | $451,100 mean, $106,000 median | US families holding any retirement account, 401(k)s and IRAs combined | 2025 survey |
- The plan type, age group or region to cover
- Regions, years and segments
- Where it runs: blog, white-label, gated or lead magnet
- Whose byline goes on it
- Deadline
- 2,500+ words, human-written
- Every figure linked to its source
- Yours to publish, under your name or none
- Hosting here for +$200, with your sponsored links
Fidelity's Q2 2026 analysis counts each plan account separately, so a worker with two old 401(k)s appears twice with two smaller balances. Its average also swings with markets: it fell to $141,000 in Q1 2026 and jumped 10.5% the next quarter, the biggest gain since Q4 2020. Past performance is no guarantee of future results, and a quarterly series makes that easy to see.
Empower's figures come from people who link accounts to the Empower Personal Dashboard™, and Empower's own methodology note says users of online financial tools tend to be more engaged in saving than the general population. Data from Empower's online financial dashboard is a textbook case of sampling bias: a self-selected group of savers who check their balances.
The Federal Reserve's Survey of Consumer Finances is the only nationally representative source. It interviews households, counts every retirement savings account a family holds across all retirement accounts, and reports in 2025 dollars. It runs once every three years, so it lags the recordkeepers. Treat the four as triangulation points on one question.
Average retirement savings by age across all accounts
A 401(k) is one bucket. Total retirement savings also include IRAs, 403(b)s and other tax-advantaged accounts, and the average retirement savings figures roughly double once those are added. Average retirement savings by age shift with the retirement accounts a source counts.
The Fed's 2025 survey found 54.9% of families hold a retirement account, up from 54.3% in 2022. Among those families, the median value rose 11% to $106,000 and the mean rose 23% to $451,100. Its Box 2 reports mean balances in IRAs and defined contribution plans by age:
The Federal Reserve's 2025 Survey of Consumer Finances found 54.9% of US families hold a retirement account, up from 54.3% in 2022.
US families holding a retirement account, 2025
Source: Federal Reservee.g. retirement savings in your state
Source: linked, checked, dated- Under 35: $48,400
- 35 to 44: $182,400
- 45 to 54: $415,800
- 55 to 64: $670,200, up from $588,500 in 2022
Empower publishes the same split for its dashboard users, counting 401(k)s, 403(b)s, IRAs and pensions together. Its average retirement savings balance across all ages is $734,731, per Empower's October 2026 analysis:
| Age group | Average retirement savings | Median retirement savings |
|---|---|---|
| 20s | $154,126 | $45,470 |
| 30s | $300,576 | $100,231 |
| 40s | $616,765 | $223,155 |
| 50s | $1,080,916 | $463,328 |
| 60s | $1,247,718 | $568,450 |
| 70s | $1,068,677 | $460,644 |
| 80s | $840,971 | $349,532 |
Both sources agree on the shape. Retirement savings by age climb through peak earning years, top out in the 60s, then fall as withdrawals begin. Empower's median for savers in their 60s is 5.5 times Vanguard's 65-and-older 401(k) median, which shows how much the self-selected sample lifts every number.
IRAs hold the other big pile. Fidelity's average IRA balance was $144,523 in Q2 2026, up 59% in ten years, and it counts both traditional and Roth IRA accounts. 401(k)s and individual retirement account balances are the two most common investment vehicles behind every figure in this section.
401(k) balance by income and job tenure
Pay and job tenure split balances sharply. Vanguard's Figure 53 splits balances by household income:
| Annual income | Average balance | Median balance |
|---|---|---|
| $30,000 to $49,999 | $29,172 | $11,659 |
| $50,000 to $74,999 | $65,239 | $29,033 |
| $75,000 to $99,999 | $114,670 | $56,115 |
| $100,000 to $149,999 | $198,912 | $103,396 |
| $150,000 and above | $401,412 | $230,536 |
Workers earning $150,000 or more hold a median 19.8 times larger than workers on $30,000 to $49,999 (our calculation). Job tenure tells the same story: the median is $3,327 for under two years with an employer and $186,335 for ten or more. A job change that resets tenure doesn't reset savings if the old account is rolled over, but Vanguard counts the new plan's balance from zero.
That's why a freelancer or someone at a small business without a plan can be well off and still missing from these tables. Employer sponsored plans only measure workers who have one.
Savings rate, employer match and automatic enrollment
Contributions do the heavy lifting early and market returns take over later. Both recordkeepers publish savings rates:
- Vanguard: average employee deferral rate of 7.6% in 2025 and a total contribution rate of 12.1% including employer money
- Fidelity: total average savings rate of 14.4% in Q2 2026, a record 9.6% from employees plus 4.8% from employers
- Fidelity: 81.2% of participants saved enough to get the full employer match, and 12.1% raised their contribution rate in the quarter
Plan design moves these numbers at scale. Vanguard counted automatic enrollment in 61% of its plans at year-end 2025, and participation ran at 94% in those plans against 64% in voluntary-enrollment plans. Workplace plans with automatic enrollment grow balances faster because nobody has to opt in.
The employer match is the cheapest money in a retirement plan, and Fidelity's figure means almost one participant in five leaves part of it unclaimed. The advice to save early is easier said than done on an entry-level salary, and a missed match is gone for that year.
2026 contribution limits and catch up contributions
The IRS announced the 2026 limits on 13 November 2025:
- Employee 401(k), 403(b) and governmental 457 contributions: $24,500, up from $23,500
- Catch up contributions at 50 and older: $8,000, so savers 50 and up can put in $32,500
- Higher catch-up for ages 60 to 63 under SECURE 2.0: $11,250, unchanged from 2025
- IRA contributions: $7,500, up from $7,000
The catch-up rules exist because balances lag targets most at the pre-retirement age. A 60-year-old using the full $11,250 catch-up can defer $35,750 in 2026 (our calculation), which is 33% of the Vanguard median balance for ages 55 to 64. These are tax-advantaged dollars, and the tax treatment differs between traditional and Roth contributions, which is a question for a tax professional.
How your savings compare with salary-multiple benchmarks
Fidelity's savings guideline frames retirement goals as multiples of salary: 1x by 30, 3x by 40, 6x by 50, 8x by 60 and 10x by an expected retirement age of 67. The assumptions are spelled out. A saver puts away 15% of income from age 25, holds more than half in stocks, retires at 67 and wants to keep a pre-retirement income lifestyle. Fidelity sizes 10x as the amount needed to retire comfortably at that standard of living.
Set that against the medians and the gap is wide. The Fed's 2025 survey puts real median family income at $82,200.
A 3x target at 40 on that income is $246,600, against a Vanguard median of $46,919 for ages 35 to 44 (our calculation). Household savings outside the plan, other retirement accounts and a second earner's account close part of the gap. Savers of the same age who are behind have their backs against the wall only if they ignore the catch-up limits above.
Fidelity's own example shows how much the desired lifestyle matters: a saver planning extensive travel needs 12x at 67, while one who downsizes may need closer to 8x.
Retirement savings goals start from the retirement lifestyle a saver wants, and defined personal goals turn a benchmark into a plan. Overall retirement planning objectives (when to stop working, where to live, how much to travel) set the multiple, and the overall retirement strategy follows from them.
A comfortable retirement at 8x and one at 12x are two different retirement planning objectives. A potential savings chart or savings potential chart from any provider is a projection built on assumed returns, so treat its end figure as a scenario.
Social Security and retirement income
Most households build retirement income from Social Security plus their own savings. The Social Security Administration's 2026 fact sheet puts the average retired-worker benefit at $2,071 a month after a 2.8% cost-of-living adjustment, or $24,852 a year (our calculation). An aged couple both receiving benefits averages $3,208 a month.
Benefits are paid from ongoing tax revenue through payroll taxes, and they're sized to replace part of a career's earnings. Fidelity's retirement guidelines say savings should replace at least 45% of pre-retirement income after Social Security, and suggest limiting withdrawals to 4% to 5% of initial savings, raised each year for inflation.
On those rules a $500,000 balance supports a first-year withdrawal of $20,000 to $25,000, and the average Social Security benefit roughly doubles it (our calculation). Putting all your eggs in one basket, Social Security alone, leaves the average retiree near $24,852 a year.
What competes with saving: debt, loans and big life expenses
Balances also leak out before retirement. Vanguard reported that 13% of participants had a retirement plan loan outstanding in 2025 where loans were offered, and hardship withdrawals rose to 6% of participants from 5% in 2024.
Housing, childcare and health costs land in the same decades as peak earning years, and those big life expenses compete with retirement savings directly. A down payment in the current housing market or credit card interest on high interest debt can absorb the cash a saver would otherwise defer. Paying off high-rate balances first is one of the other financial best practices most planners list next to the match.
Financial priorities usually run in one order across planners: capture the full match, clear high interest debt, hold an emergency fund for financial stability, then raise the savings rate toward 15% by sending part of each raise into the plan. Rolling old employer plans into one account makes the total easier to track. Achieving financial success in retirement comes down to that sequence repeated for decades, and the early bird catches the worm on compounding.
Gaps in insurance coverage hit the same budget. The insurance statistics report covers the protection side, which a retirement savings plan doesn't replace. For younger savers, Gen Z's financial picture shows how early-career pay and debt shape the first decade of saving.
How these statistics are tracked
Recordkeeper data is administrative: Vanguard and Fidelity see every dollar in the plans they run, so their figures are exact for their own book and silent about everyone else. The Fed's survey is the reverse. It covers the whole country through interviews, so it inherits the limits of self-reported data and response bias, and it arrives every three years.
Compounding explains most of the age curve, and it's why retirement readiness depends on when a saver starts. At a 7% annual return a balance doubles in a little over ten years, and the CAGR calculator shows the growth rate between any two balances. Defined contribution plans that start at 25 get four doublings by 67 at that rate, and a saver who starts at 45 gets two. Keep an eye on the start date before the balance.
This page reports statistics for comparison, and it isn't investment advice or a recommendation of any particular investment. A certified financial planner, financial advisor or other financial professional can match savings objectives to a specific financial life, and a tax professional covers the Roth and catch-up questions.
Where the 401(k) figures come from, and what no plan provider publishes
Plan data: workplace.vanguard.com (How America Saves 2026, balances at 31 December 2025), about.fidelity.com (Q2 2026 retirement analysis) and empower.com (dashboard averages and its October 2026 retirement savings analysis). Household data: federalreserve.gov (2025 Survey of Consumer Finances).
Limits and benefits: irs.gov (2026 contribution limits) and ssa.gov (2026 cost-of-living fact sheet). Fidelity's millionaire count was read via money.com, and its savings guidelines on fidelity.com. All figures checked 19 November 2026.
Each provider counts only the participants in the plans it runs, so no published figure covers every US 401(k) account, and the Federal Reserve's survey counts families across all retirement account types.
Delivered for your site and your byline. Hosting here is optional.
Frequently asked questions
How many Americans have $1,000,000 in their 401(k)?
Fidelity counted 769,000 401(k) accounts holding $1 million or more at the end of June 2026, a record and up from 654,000 in March, according to figures Fidelity confirmed to Money. That's about 3% of Fidelity's 25.8 million participants (our calculation), and it covers Fidelity's plans only.
How much does the average 65-year-old have in retirement savings?
In Vanguard plans, participants 65 and older had an average 401(k) balance of $330,186 and a median of $103,202 at the end of 2025. Empower reports an average of $1,247,718 and a median of $568,450 in total retirement savings for its users in their 60s, a more engaged sample.
What is a good 401(k) balance at age 65?
Fidelity's guideline is 10x final salary by 67 for savers who want to keep their pre-retirement lifestyle, counting all retirement accounts, Roth IRA and 401(k) alike. On the Fed's 2025 median family income of $82,200, that's $822,000 (our calculation).
Does a 401(k) double every 7 years?
Only at a return of about 10% a year. The rule of 72 divides 72 by the annual return, so 7 years implies 10.3%. Vanguard's average balance grew 13% in 2025, while Fidelity's fell 4% in Q1 2026, so doubling time varies with the market.
How long will a $500,000 401(k) last in retirement?
At Fidelity's suggested 4% to 5% initial withdrawal, raised for inflation, $500,000 pays $20,000 to $25,000 in year one. Fidelity sizes that rate to make savings last through a long retirement; spending more each year shortens it.
Bottom line
The average 401k balance by age runs from $7,259 to $330,186 in Vanguard's plans, and the median from $2,234 to $107,269. The median is the number to compare against, because 18% of accounts above $250,000 carry the average.
Fidelity, Empower and the Fed report different figures because they count different savers on different dates. Each figure is correct for its own sample.
The levers that move a balance are the savings rate, the employer match, automatic enrollment and time. Median savings by age, read with the right sample, is the honest yardstick for anyone comparing average retirement savings with their own. The data shows plenty of workers with balances far below the salary-multiple benchmarks at every age.
Advisers, fintech apps and plan providers use reports like this one in client newsletters, blog pages and lead magnets.
A report on your topic for a blog page, gated content or a lead magnet.
Written for your client and published under their brand, with my name left off.
Your report on marketintelligencetools.com, with 2 to 3 CTAs carrying your sponsored links.
Default terms: the report is yours to publish, and I keep the right to republish it on this site behind a gate, outside Google's index.