Average customer acquisition cost by industry 2026: $87 to $1,166 per B2B customer
 By Jan Suski. I go deep on every review, checking every number against its source and digging up details other coverage misses, a habit from six years of SEO and link building for tech companies. Bylines at Brand24 and Senuto. How the scoring works.
The average customer acquisition cost for a B2B company runs from $87 in eCommerce to $1,166 in education, across 27 industries in First Page Sage's November 2026 benchmark. B2B SaaS sits near the bottom at $243 per customer. The average cost per lead across 30 industries is $400, per the same firm's October 2026 data.
This report collects customer acquisition cost (CAC) benchmarks, cost per lead figures and customer lifetime value ratios from the firms that publish them. First Page Sage covers CAC and cost per lead by industry, WordStream by LocaliQ covers paid search leads, Shopify covers small ecommerce stores, and the Aleph and Benchmarkit 2026 survey covers SaaS CAC ratios and payback.
It's written for marketers setting a marketing budget, founders checking unit economics, and finance teams comparing their own CAC with industry benchmarks. The figures matter because each publisher counts different costs, and two benchmarks for the same industry can sit hundreds of dollars apart.
The numbers CAC, cost per lead and SaaS ratios, checked November 2026
Education costs 13 times as much per customer as eCommerce in the B2B data, so an industry average only means something next to your own sector's row.
Search ad leads got cheaper in 2026 for the first time in five years, falling to $66.69 from $70.11.
The median SaaS company earns back 4.1 dollars of lifetime value for each acquisition dollar, so its customers pay for themselves four times over.
Agencies, SaaS vendors and growth consultants quote acquisition costs in every pitch. Send the industry, the channel or the company size and I'll source a version you own.
Average customer acquisition cost by industry: B2B
First Page Sage's B2B edition, published 4 November 2026, uses anonymized client data and its own research from January 2022 through October 2026. It defines CAC as total marketing and sales spend divided by the number of new customers acquired, and reports an organic, an inorganic and a combined average CAC for each industry.
| Industry | Organic CAC | Inorganic CAC | Combined average CAC |
|---|---|---|---|
| Education | $862 | $2,078 | $1,166 |
| Real estate | $660 | $1,240 | $805 |
| Financial services | $644 | $1,258 | $798 |
| Oil and gas | $710 | $1,050 | $795 |
| Legal services | $584 | $1,303 | $764 |
| Commercial insurance | $590 | $628 | $600 |
| IT and managed services | $325 | $879 | $464 |
| Cybersecurity | $345 | $536 | $393 |
| Entertainment | $190 | $490 | $265 |
| B2B SaaS | $205 | $357 | $243 |
| Pharmaceutical | $196 | $167 | $189 |
| eCommerce | $87 | $85 | $87 |
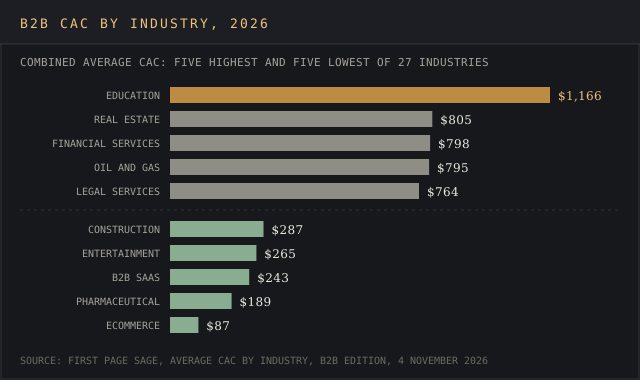
Long decision cycles and high-value contracts are par for the course in education, real estate, legal services and financial services. Each customer brings years of fees, so firms that sell to those customers accept a higher cost per acquisition. The entertainment industry and eCommerce sit at the bottom, where purchases are smaller and quicker.
Organic CAC against paid channels
Organic CAC is lower than inorganic CAC in 25 of the 27 B2B industries in the table. Education's organic CAC of $862 is less than half its inorganic CAC of $2,078. Pharmaceutical and eCommerce are the two exceptions, where paid channels come in a few dollars cheaper.
First Page Sage counts SEO and organic social as organic channels, and PPC and paid social as inorganic. It weights the combined average CAC 75% organic and 25% inorganic, which reflects the firm's own SEO client base. A company that spends mostly on paid channels should zero in on the inorganic column, since its blended CAC will sit closer to it.
B2C customer acquisition cost by industry
The B2C edition, published the same day from 103 client accounts across 20 industries, reports organic and paid CAC without a combined figure. The cross-industry averages are $167 organic and $240 paid.
| B2C industry | Organic CAC | Paid CAC |
|---|---|---|
| Aviation | $475 | $708 |
| Addiction treatment | $357 | $506 |
| Legal services | $208 | $516 |
| Financial services | $161 | $197 |
| SaaS | $150 | $223 |
| Real estate | $114 | $260 |
| Entertainment | $82 | $106 |
| eCommerce | $74 | $79 |
Copy these lines into an email, fill them in and send. I reply with scope and a price within 2 to 3 business days.
Open the emailFor small online stores, Shopify's figures run lower still. Using data it collected in 2021 on ecommerce brands with fewer than four employees, Shopify puts annual average CAC at $21 for arts and entertainment, $127 for health and beauty, $129 for fashion and accessories, $129 for home, furniture and garden, and $377 for electronics.
Why CAC benchmarks vary so much
CAC benchmarks vary by publisher for four reasons, and each one can move the number by hundreds of dollars. Reading the method line before the dollar figure saves a lot of wasted budget allocation.
- What counts as cost: First Page Sage includes marketing and sales spend, while many in-house CAC figures count only ad spend.
- Which channels: First Page Sage excludes email marketing, events, direct mail and outdoor advertising for lack of data.
- Who's in the sample: Shopify's 2021 figures cover stores with under four employees, and First Page Sage's figures come from its own clients.
- How it's weighted: a 75% organic weighting pulls the combined CAC toward the cheaper channel.
Business size matters too. A three-person store buying Meta ads and a 500-person SaaS firm paying account executives can both report "CAC" and mean different things. The devil's in the details, so the industry standards worth comparing against are the ones built on your own cost definition.
SaaS CAC ratio and payback
SaaS companies tend to track CAC against new revenue, which gives customers a dollar value on arrival. The 2026 Aleph and Benchmarkit report, published 1 June 2026 from full-year 2025 data on 342 B2B SaaS and AI-native companies, puts the median new-name CAC ratio at $1.63 of sales and marketing spend per $1 of new-customer ARR, a 19% improvement on the year before.
The blended CAC ratio, which adds expansion revenue from existing customers, came in at $1.30. Our sales statistics report covers the quota and win-rate side of the same efficiency. Median CAC payback was 16 months, down from 18, with the top quartile recovering costs in 6 months or less. Our SaaS magic number calculator runs the related efficiency check on your own numbers.
Average cost per lead by industry
Cost per lead sits one step earlier in the funnel than CAC, at the lead generation stage. First Page Sage's October 2026 report measures it as total marketing spend divided by the number of new leads from a channel, across 30 industries from January 2022 through August 2026. Its average CPL is $400 blended, $452 for paid leads and $350 for organic leads.
| Industry | Paid CPL | Organic CPL | Blended average CPL |
|---|---|---|---|
| Higher education | $1,176 | $766 | $970 |
| Legal services | $783 | $580 | $682 |
| Financial services | $731 | $591 | $662 |
| Software development | $691 | $573 | $627 |
| IT and managed services | $600 | $418 | $505 |
| Real estate | $496 | $450 | $472 |
| B2B SaaS | $318 | $186 | $249 |
| Entertainment | $115 | $114 | $115 |
| eCommerce | $102 | $90 | $96 |
| HVAC | $118 | $73 | $96 |
- The industries, channels or lead types to compare
- Regions, years and segments
- Where it runs: blog, white-label, gated or lead magnet
- Whose byline goes on it
- Deadline
- 2,500+ words, human-written
- Every figure linked to its source
- Yours to publish, under your name or none
- Hosting here for +$200, with your sponsored links
Higher education leads cost an arm and a leg at $970 blended, and eCommerce and HVAC tie for the lowest at $96. Leads acquired through organic channels cost less than paid leads in 28 of the 30 industries.
Cost per lead in paid search
Paid search leads cost far less on the platform-reported numbers. WordStream by LocaliQ's 2026 benchmarks, built from 13,474 US search campaigns between April 2025 and March 2026, put the average CPL in Google and Microsoft Ads at $66.69. That's down from $70.11 in the 2025 edition, Search Engine Land reported, while the average cost per click rose to $5.42.
Attorneys and legal services had the highest search CPL at $131.63 and arts and entertainment the lowest at $26.84. Conversion rates averaged 8.18%, which explains how the cost per lead fell while clicks got pricier. WordStream's figure counts form fills and calls tracked as conversions, and First Page Sage's counts direct contact with a prospect, so the two average CPL numbers measure leads of different quality.
A $50 lead that never closes is worth less than a $500 lead that becomes a customer. Unqualified prospects inflate leads generated without moving customer acquisition, which is why the cost per lead only tells half the story. Our PPC statistics report covers the click costs behind these lead figures, and our search engine marketing statistics cover paid search budgets.
Customer lifetime value and the LTV to CAC ratio
Customer lifetime value (CLV or LTV) is the profit a customer brings over the whole relationship. First Page Sage's method divides profit for a period by the number of unique customers, then multiplies by the average customer lifespan in years. A customer acquisition cost only reads as good or bad next to that figure.
| LTV to CAC ratio | What it signals, per First Page Sage |
|---|---|
| Below 1 to 1 | Each customer loses money, a red flag |
| 1 to 1 up to 2 to 1 | Marginal, with high churn or overspending on acquisition |
| 2 to 1 up to 3 to 1 | Workable with a lean cost structure |
| 3 to 1 up to 5 to 1 | Healthy, the standard target range |
| Above 5 to 1 | Strong, and possibly underinvesting in growth |
Measured SaaS results sit above that target. The Aleph and Benchmarkit data puts the median customer lifetime value to CAC ratio at 4.1x across the 146 companies that reported it, 7.8x for the top quartile and 1.1x for the bottom quartile. Companies above $100 million of ARR raise the bar at 8.0x, and those between $20 million and $100 million about 3.1x.
The Aleph and Benchmarkit data puts the median B2B SaaS customer lifetime value to CAC ratio at 4.1x, 7.8x for the top quartile and 1.1x for the bottom quartile.
Median LTV to CAC ratio, B2B SaaS, 2025
Source: Aleph and Benchmarkite.g. LTV to CAC ratios for your software category
Source: linked, checked, datedA customer lifetime value by industry table built on the same method as these CAC figures is a needle in a haystack, so cross-industry CLV comparisons rest on each company's own numbers. High value customers in legal services or financial services justify a $700 to $800 CAC because their customer lifetime runs for years, while a $90 eCommerce CAC can still lose money on a one-time buyer.
Retention and long term value
Retention decides the lifetime half of the ratio. Median gross revenue retention in the Aleph and Benchmarkit panel fell to 84% in 2025 from 88% a year earlier, Aleph reported. A 90% retention rate beats that median. Retention work kills two birds with one stone, since it lengthens the average customer lifespan and raises the CAC a business can afford, and our customer retention statistics report breaks the figures down by industry.
How to calculate CAC
Customer acquisition cost (CAC) is the money spent to win one new customer. To calculate CAC, divide total acquisition costs for a period by the number of new customers acquired in the same period. First Page Sage recommends an annual or rolling annual window, since a single month can catch a long sales cycle half-finished.
The formula: CAC = (total marketing spend + sales costs) / new customers acquired.
- Marketing costs: ad spend, content marketing, SEO, tools, agencies and the marketing team's salaries
- Sales costs: account executives, sales development reps, commissions and sales software, from tools priced in our CRM software cost and sales engagement pricing reports
- Exclude: spend on retaining or upselling existing customers
In a worked example, a company spends $60,000 on marketing campaigns and $90,000 on sales efforts in a quarter and wins 200 new customers. Its customer acquisition cost is $150,000 divided by 200, or $750. Dividing total marketing spend alone by the same customers gives $300, which is the marketing-only CAC many dashboards show.
Including salaries gives the true total cost, and leaving them out flatters the number. Track CAC per channel as well as blended CAC, since a segment CAC for paid search can run three times the organic CAC in the same quarter. Sales cycle length matters for timing. In a six-month cycle, this quarter's spend buys next half-year's customers.
What raises and lowers customer acquisition cost
The drivers show up in the benchmark data itself, and each one maps to a figure above. Marketing strategies that cut CAC work on one of these levers, and the lowest CAC in any industry belongs to the companies that pull several at once to win customers.
- Channel mix: organic CAC beat paid CAC in 25 of 27 B2B industries
- Competition: crowded auctions push up click prices, and the average search CPC reached $5.42
- Conversion rates: higher conversion rates cut search CPL even as clicks got pricier
- Retention: falling retention shortens customer lifetime and shrinks the affordable CAC
- Deal size and sales processes: long, multi-stakeholder sales cycles carry the highest average CAC
A leaky funnel raises CAC from the inside, since every unqualified prospect that reaches sales eats time without becoming a customer. Email marketing and content marketing to an existing audience tend to be the cost effective fixes, because the audience is already paid for.
Social media marketing, digital advertising and search engine optimization all compete for the same marketing budget, so resource allocation comes down to which channel delivers high quality leads at the lower cost.
Lead generation quality over volume
High quality leads lower CAC because sales time spent on poor leads still counts in the cost of every customer won. A lead generation program that sends 100 leads generated from a tight target audience at $300 each can beat one that sends 400 leads at $75 if more of the first group become customers. Marketing campaigns should report cost per customer next to cost per lead, so marketing costs and sales costs get judged on the same outcome.
Content marketing and email marketing reach potential customers who already know the brand (our email marketing statistics cover the returns), and that's why both tend to be cost effective at the bottom of the funnel. Marketing efforts that score leads before they reach sales, and drop the ones that don't fit, cut CAC without cutting customers.
Our B2B marketing statistics report covers where budgets go, and the SaaS statistics report covers churn and spending for software firms. Teams that buy outbound data can compare intent data pricing against their current cost per lead before they sign.
Using CAC benchmarks in marketing strategies
CAC benchmarks are most useful for informed decisions about where the next dollar of marketing budget goes. The industry average tells you if your number is in the normal range, and the channel split tells you where to move money. Inside one company, costs per customer acquisition (CAC) vary by channel because each channel reaches potential customers at a different point in the customer journey.
- Lead generation through search reaches customers who are already looking for a product, which is why organic CPL beat paid CPL in 28 of 30 industries
- Paid social reaches a target audience that hasn't searched yet, so more of the money spent goes to awareness
- Sales efforts on large contracts cost more per customer and tend to bring the most valuable customers
The lowest CAC channel can also be the slowest. Organic channels in First Page Sage's data take 4 to 6 months to show results from SEO, so a company that needs customers this quarter pays the paid-channel premium. The right mix spreads marketing efforts across channels, so a company doesn't put all its eggs in one basket and each channel stays near its own good cost per customer.
A good CAC and a good cost per lead both depend on what customers are worth. B2B SaaS companies with a $243 average customer acquisition cost and a 4.1x lifetime value ratio are making money on each of their customers, and a law firm paying $764 can be too, if clients stay for years. Customers who leave in the first year make any CAC expensive, so CAC belongs next to retention on any digital marketing dashboard.
Delivered for your site and your byline. Hosting here is optional.
Frequently asked questions
What is the average customer acquisition cost?
It depends on the industry. First Page Sage's 2026 B2B averages run from $87 in eCommerce to $1,166 in education, with B2B SaaS at $243. Its B2C averages are $167 for organic channels and $240 for paid channels.
What's a good CAC ratio?
For SaaS, the 2025 median new-name CAC ratio was $1.63 of sales and marketing spend per $1 of new ARR, per Aleph and Benchmarkit. Spending less than that per dollar of new ARR puts a company ahead of the median.
What is a good LTV to CAC ratio?
3 to 1 or higher is the standard target. Below 1 to 1 means each customer loses money. The 2025 SaaS median measured by Aleph and Benchmarkit was 4.1x.
What is a reasonable cost per lead?
First Page Sage's 2026 average is $400 blended across 30 industries. For Google and Microsoft search ads, WordStream by LocaliQ measured $66.69 on average, from $26.84 in arts and entertainment to $131.63 in legal services.
What industry pays the most for leads?
Higher education, at $970 blended in First Page Sage's 2026 data. Legal services follows at $682 and financial services at $662.
What is a good cost per customer acquisition?
One that sits at or below your industry's row for similar customers and below a third of what customers are worth over their lifetime. In First Page Sage's 2026 B2B data, that means under $243 for SaaS, under $600 for commercial insurance and under $1,166 for education.
How do I figure out my customer acquisition cost?
Add up marketing and sales costs for a period, including salaries, and divide by the number of new customers acquired in that period. $150,000 of spend and 200 new customers gives a $750 CAC.
What is a good customer lifetime value?
At least three times your CAC. A customer who costs $300 to acquire should bring $900 or more in profit over the relationship.
Is 90% customer retention good?
For B2B SaaS, yes. Median gross revenue retention in the 2026 Aleph and Benchmarkit data was 84%, so 90% beats the median.
What is AOV and LTV in marketing?
AOV is average order value, the average amount customers spend per order. LTV is customer lifetime value, the profit customers bring over the whole relationship, which grows with order value, purchase frequency and how long customers stay.
Should salaries count in CAC?
Yes, for a full customer acquisition cost (CAC) that compares fairly across customers. First Page Sage's definition includes all marketing and sales spend, and salaries are usually the lion's share of sales costs.
Bottom line
The average customer acquisition cost is a range, from $87 to $1,166 across B2B industries in First Page Sage's 2026 data, and the right benchmark is your own industry's row. B2B SaaS sits low at $243, while education, real estate and financial services cost about $800 to $1,166 per customer.
Each CAC figure only means something next to customer lifetime value. The 2025 SaaS median of 4.1 dollars of lifetime value per acquisition dollar shows what healthy looks like, and a 16-month median payback is worth keeping an eye on, since it shows how long the money is tied up. Track CAC by channel with salaries included, and compare it with industry benchmarks that count costs the same way.
Agencies, SaaS vendors and finance teams use reports like this one in sales decks, board packs and client briefs.
A report on your topic for a blog page, gated content or a lead magnet.
Written for your client and published under their brand, with my name left off.
Your report on marketintelligencetools.com, with 2 to 3 CTAs carrying your sponsored links.
Default terms: the report is yours to publish, and I keep the right to republish it on this site behind a gate, outside Google's index.
Where each CAC benchmark comes from, and the costs the benchmarks leave out
CAC by industry comes from First Page Sage's B2B edition (November 2026, 27 industries) and its B2C edition, published the same day from 103 client accounts across 20 industries. Small-store figures come from Shopify and cover stores with under four employees.
Cost per lead comes from First Page Sage's October 2026 report (30 industries, January 2022 to August 2026) and WordStream by LocaliQ's 2026 search advertising benchmarks (13,474 US campaigns, April 2025 to March 2026), with the 2025 comparison as reported by Search Engine Land.
SaaS ratios, payback and retention come from the 2026 Aleph and Benchmarkit report, published 1 June 2026 from full-year 2025 data on 342 B2B SaaS and AI-native companies.
All figures were checked on 19 November 2026. First Page Sage's CAC figures leave out email marketing, events, direct mail and outdoor advertising for lack of data, and its B2C edition publishes no combined CAC figure.