Box office statistics: $33.6 billion worldwide in 2025 and a $34.7 billion 2026 forecast
 By Jan Suski. I go deep on every review, checking every number against its source and digging up details other coverage misses, a habit from six years of SEO and link building for tech companies. Bylines at Brand24 and Senuto. How the scoring works.
The numbers Global and North American box office, checked 19 November 2026
Global box office revenue is still about a fifth below 2019, whichever tracker you use.
North America sold 38% fewer tickets in 2025 than in 2019, and higher prices covered part of the gap.
Production is at an all-time high while theaters are not: 9,628 feature films in 2024, against 9,223 in 2019.
I'll write a 2,500+ word report on the market you name, with tracker data, trade body figures and filings linked to their sources. Yours to publish, from $200.
The global box office took in $33.55 billion in 2025, according to Gower Street Analytics, the second-highest total since 2019 and 16% below the pre-pandemic average. North America sold 754 million tickets at an average ticket price of $11.31, per The Numbers, against 1.23 billion tickets in 2019.
This report gathers the box office statistics published by the trackers, trade bodies and statistics offices that measure cinema: global and North American box office revenue, ticket sales and prices, studio market share, the largest international markets, feature films produced by country, and who works behind the camera. Every figure names the house that produced it.
It's for analysts, marketers, investors and film industry professionals who need numbers they can cite; the key figures table below gives the headline data, and each section after it goes deeper. The houses disagree, sometimes by billions of dollars, so the report shows their figures side by side and explains the gaps.
Global box office revenue by year
The global box office peaked at $42.3 billion in 2019, collapsed during the pandemic, and has spent five years climbing back. Gower Street's annual figures put 2023 at $33.9 billion and 2025 at $33.55 billion, a fall of 1% at current exchange rates. Its forecast for 2026, issued in December 2025, was $35.0 billion; in April 2026 it revised that to $34.7 billion, which would be the best year since 2019.
Omdia, which publishes its global box office data through the World Intellectual Property Organization, reports a similar shape at a slightly lower level. Its May 2026 WIPO article puts global box office at $42.0 billion in 2019, $33.2 billion in 2023, $30.6 billion in 2024 and $32.8 billion in 2025, about 22% below 2019.
| Year | Gower Street Analytics | Omdia via WIPO | Gap |
|---|---|---|---|
| 2019 | 42.3 | 42.0 | 0.3 |
| 2023 | 33.9 | 33.2 | 0.7 |
| 2024 | Not published as a single figure | 30.6 | n/a |
| 2025 | 33.55 | 32.8 | 0.75 |
| 2026 forecast | 34.7 | None published | n/a |
Copy these lines into an email, fill them in and send. I reply with scope and a price within 2 to 3 business days.
Open the emailGlobal box office revenue by year, two trackers ($ billions)
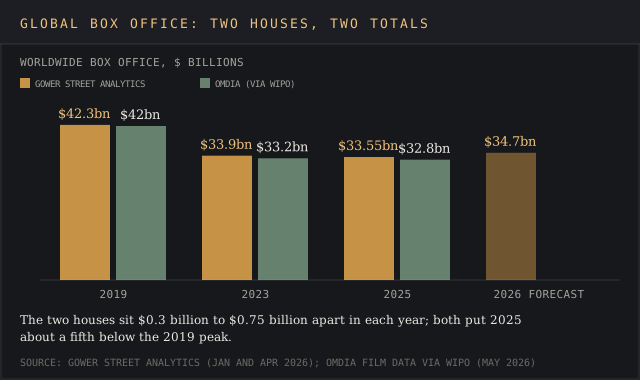
Read either series and the same conclusion holds. The theatrical market in 2025 was about a fifth smaller than in 2019, and 2026 is the first year since the pandemic with a forecast close to $35 billion. Gower Street's own measure puts 2025 $6.6 billion below the 2017 to 2019 average at current exchange rates.
Why the published box office estimates diverge
Box office data looks like a simple count of ticket sales, but each tracker decides which markets to include and which exchange rate to use. Those choices produce different totals for the same year, and the gaps run to billions of dollars at the global level.
Here is where the published figures part ways:
- Exchange rates. Gower Street restates earlier years at current exchange rates when it compares them, and notes that its charts show historical rates for years before 2025. The same year can therefore carry two Gower Street totals depending on the comparison.
- Different trackers. Omdia's 2025 global total of $32.8 billion sits $0.75 billion below Gower Street's $33.55 billion.
- Undisclosed methods. In an October 2026 column, Forbes contributor Mark Hughes put 2023 worldwide box office at $28.2 billion and projected $27 billion to $28 billion for 2026, without naming a data source. Gower Street's figures for the same years are $33.9 billion and $34.7 billion.
- Domestic totals. The Numbers lists 2025 North American box office at $8.53 billion; Gower Street puts US and Canada at $8.87 billion.
- Single films. Gower Street credits Demon Slayer: Infinity Castle with $779 million worldwide; Box Office Mojo's 2025 calendar-year chart shows $718.5 million, as Anime News Network reported.
The practical rule: compare years within one tracker's series, never across trackers, and name the source next to any total you quote. A gap of $5.7 billion between two headlines about the same year, Forbes against Gower Street on 2023 by my subtraction, is par for the course in this market, and it usually comes from method.
The 2026 box office so far
2026 has been the strongest year of the decade. Gower Street's first-half review reported $16.6 billion of global box office revenue in January to June including China, up 2% on 2025, and a second quarter of $7.85 billion, the best quarter since 2019 and the first time this decade a quarter came that close to pre-pandemic levels.
Gower Street's first-half review splits it by region:
- Domestic (US and Canada): $4.8 billion from January to June, up 15%, with Q2 at $2.99 billion, the best domestic quarter this decade.
- International excluding China: $9.26 billion over the same six months, 7% below the 2017 to 2019 average.
- China: $2.6 billion in those six months, 40% below the pre-pandemic benchmark, with June the weakest of the decade.
The summer ran hot. Spider-Man: Brand New Day and Christopher Nolan's The Odyssey gave the US box office its biggest opening weekend on record in early August, Reuters reported, and the summer season finished nearly 10% ahead of 2019 on Comscore's Rentrak data, according to CNBC's reporting.
Five 2026 films had each earned over $1 billion worldwide by late August: Brand New Day, The Odyssey, Toy Story 5, Michael and The Super Mario Galaxy Movie, NPR reported, more than in any year since the pandemic began.
Forbes put Sony's Marvel sequel above $2.5 billion and The Odyssey near $1.8 billion by late October, with domestic box office around $8.3 billion. With more big movies coming in December, Hollywood has a shot at its best year since 2019: Dune: Part Three and Avengers: Doomsday both open on 18 December, Cord Cutters News reported.
North American box office: tickets, prices and attendance
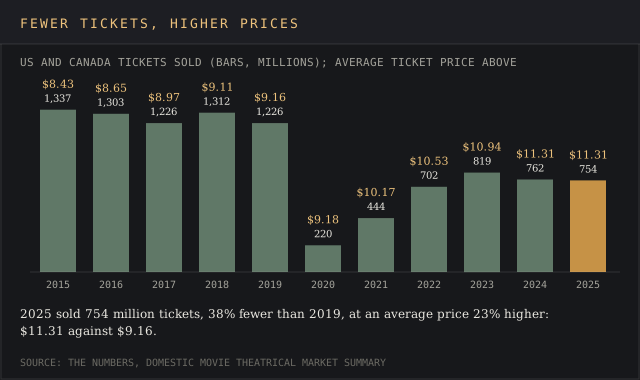
North American box office revenue was $8.53 billion in 2025 on 754 million tickets, according to The Numbers, almost flat against 2024's $8.62 billion and 762 million tickets. The gap to 2019 is the story: 1.23 billion tickets sold that year for $11.23 billion.
| Year | Tickets sold (millions) | Box office ($ millions) | Average ticket price | Wide movies released |
|---|---|---|---|---|
| 2015 | 1,337 | 11,269 | $8.43 | 127 |
| 2019 | 1,226 | 11,226 | $9.16 | 130 |
| 2020 | 220 | 2,019 | $9.18 | 55 |
| 2022 | 702 | 7,396 | $10.53 | 110 |
| 2023 | 819 | 8,963 | $10.94 | 149 |
| 2024 | 762 | 8,620 | $11.31 | 174 |
| 2025 | 754 | 8,529 | $11.31 | 169 |
North American box office data by year
The table shows the trade the motion picture industry made after 2020. Admissions fell 38% from 2019 to 2025 while the price per ticket rose 23%, so revenue held up better than attendance. Adjusted for inflation, The Numbers puts 2019 box office at $13.86 billion, 63% above 2025.
Want a tickets and price chart like this for your own country? Send the market and the years.
Email a briefAverage ticket price in 2026
Admission prices kept climbing in 2026. Research firm EntTelligence put the average adult ticket price at $13.46 through 30 July 2026, with premium formats such as IMAX averaging $18.22, according to AP's report. The two figures measure different things: EntTelligence's is the adult ticket, while The Numbers' $11.31 spreads total box office across every ticket sold.
Exhibitors' own filings show the same move. Marcus Theatres reported average ticket prices up 5.2% and same-store attendance up 10.9% in its fiscal second quarter of 2026. Cinemark's average US ticket price rose 4.2% to $10.83 in its second quarter, with attendance up 17.9%, Fortune reported, and the company credited a "higher premium format mix."
Premium screens and fewer movie theaters
Premium large-format screens carry a growing share of revenue. IMAX, ScreenX and Dolby Cinema made up nearly 15% of US and Canadian ticket revenue in 2025, up from 9.8% in 2019, and the number of US movie screens fell about 12% between 2020 and 2024 to 38,000, according to Reuters and S&P Global data reported by Bisnow.
Attendance is recovering more slowly than revenue. Foot-traffic data from Placer.ai showed US theater attendance up 8.1% on 2025 through July 2026 but still 27% below 2019, Reuters reported. Fewer people, paying more per seat, in fewer movie theaters: that is the North American box office in 2026.
Box office history: three decades of North American data
The Numbers' records go back to 1995, and the long view puts the recent past in context. In 1995 North American movie theaters sold 1.22 billion tickets for $5.31 billion, at an average of $4.35. Ticket sales peaked in 2002 at 1.58 billion, and box office revenue peaked in 2018 at $11.95 billion.
| Year | Tickets sold (millions) | Box office revenue ($ millions) | Average ticket price |
|---|---|---|---|
| 1995 | 1,222 | 5,315 | $4.35 |
| 2000 | 1,395 | 7,520 | $5.39 |
| 2002 | 1,576 | 9,156 | $5.81 |
| 2009 | 1,419 | 10,639 | $7.50 |
| 2018 | 1,312 | 11,948 | $9.11 |
| 2025 | 754 | 8,529 | $11.31 |
- The markets, studios or formats to compare
- Regions, years and segments
- Where it runs: blog, white-label, gated or lead magnet
- Whose byline goes on it
- Deadline
- 2,500+ words, human-written
- Every figure linked to its source
- Yours to publish, under your name or none
- Hosting here for +$200, with your sponsored links
North American box office history, selected years
Outside the 2020 to 2022 pandemic period, 2025's 754 million tickets is the lowest count in The Numbers' records back to 1995. It is 52% below the 2002 peak, my arithmetic, while box office revenue in current dollars was only 7% lower.
Over three decades the motion picture industry in North America has sold fewer tickets at steadily higher prices, and the pandemic sped up a trend that was already under way: annual ticket sales slipped from 1.58 billion in 2002 to 1.26 billion in 2014, per The Numbers.
Box office revenue by genre
Adventure and action movies have taken 48% of North American box office revenue since 1995, according to The Numbers' genre table: adventure 25.26% and action 22.77%. Drama and comedy follow at 14.17% and 14.09%.
- Thriller and suspense: 7.39% of box office revenue since 1995.
- Horror: 6.17%.
- Romantic comedy: 4.38%; musical: 2.74%.
- Documentary: 0.90%; western: 0.65%; concert and performance films: 0.25%.
Genre also predicts who buys the ticket. Moviegoers aged 13 to 34 bought 73% of North American horror tickets in 2025, per Comscore data in Cinema United's update.
Studio market share: Disney, Warner Bros and Universal
Disney, Warner Bros. and Universal took the lion's share of the 2025 domestic market, 62% between them, according to The Numbers' 2025 distributor table. Walt Disney led with 15 films and a 22.60% share, Warner Bros. followed at 21.47% from 25 films, and Universal took 18.06% from 40 releases.
Theatrical distribution in the film industry is concentrated at the top and crowded underneath. In The Numbers' 2025 distributor table, Universal ran the busiest distribution slate of the majors, at 40 films, while the two leading independent distribution companies, A24 and Neon, released 20 films each and took 2.66% and 1.20% of the domestic market.
| Distributor | Movies | 2025 gross ($ millions) | Tickets (millions) | Share |
|---|---|---|---|---|
| Walt Disney | 15 | 1,966 | 173.8 | 22.60% |
| Warner Bros. | 25 | 1,868 | 165.1 | 21.47% |
| Universal | 40 | 1,571 | 138.9 | 18.06% |
| Paramount Pictures | 17 | 565 | 50.0 | 6.50% |
| Sony Pictures | 31 | 557 | 49.2 | 6.40% |
| 20th Century Studios | n/a | 452 | 40.0 | 5.20% |
| Lionsgate | 15 | 331 | 29.3 | 3.81% |
| A24 | 20 | 231 | 20.4 | 2.66% |
Distribution market share by distributor, 2025
Disney also owns 20th Century Studios, so its combined 2025 share was 27.8%, my addition. Sony Pictures finished fifth in 2025 at 6.40%, a year before its Marvel sequel topped the 2026 charts. Over the 1995 to 2025 period, The Numbers' all-time distribution table puts Disney first at 17.29%, Warner Bros. at 15.14% and Universal at 12.51%.
International markets: China, Japan, India and Europe
International markets earned about three quarters of global box office revenue in 2025. Gower Street put international box office excluding China at $17.3 billion, the best year of the decade by a small margin, and China at $7.4 billion. Domestic took $8.87 billion.
China
China's 2025 box office revenue of $7.4 billion was its second-best year of the decade, up 21% on 2024 but 11% below the pre-pandemic average, per Gower Street. One film did the heavy lifting: Ne Zha 2 grossed over $2.1 billion in China, the highest-grossing local title ever there and the top global title of 2025, and it alone made up 29% of China's box office. Only about $60 million of its total came from outside China.
Japan
Japan's film industry had its best year on record. The Motion Picture Producers Association of Japan, known as Eiren, reported box office of ¥274.45 billion ($1.8 billion) for the year to 30 November 2025, up 32.6%, and a record average ticket price of ¥1,454, Screen Daily reported. Eiren's members are the production companies Shochiku, Toho, Toei and Kadokawa.
Local productions carried the year. Demon Slayer: Infinity Castle took ¥39.14 billion and the kabuki drama Kokuho ¥19.55 billion, according to Jiji Press, and the total beat the ¥261.18 billion set in 2019.
India
India's box office revenue reached a record ₹13,395 crore in 2025, beating the ₹12,226 crore record from 2023, according to the Ormax Box Office Report. Hindi cinema, the country's largest film industry, took ₹5,504 crore, its best year ever and 41% of the market, and 37 films crossed ₹100 crore, against 22 in 2024. Admissions fell about 6% to 83.2 crore, Filmibeat reported from the same report, so India's record also rests on higher ticket prices.
India's box office revenue reached a record ₹13,395 crore in 2025, beating the ₹12,226 crore record from 2023, according to the Ormax Box Office Report.
India box office revenue, 2025, a record
Source: Ormax Mediae.g. box office totals for the markets your clients release in
Source: linked, checked, datedEurope
European cinemas took box office revenue of close to €6.9 billion in 2025, down 1%, on 863.6 million admissions, down 5.3%, according to the UNIC report summarized by Celluloid Junkie. Germany grew 6.4% to €924 million, and local films took 27.4% of German admissions, their highest share since 2022. Gower Street expects Europe, the Middle East and Africa to reach $10.05 billion in 2026.
Asia-Pacific, Latin America and the 2026 regional forecast
Gower Street's December 2025 forecast for 2026 split the world into regions: Europe, the Middle East and Africa at $10.05 billion, Asia-Pacific excluding China at $5.3 billion, Latin America at $2.65 billion and China at $7.1 billion, down 4%, as Dark Horizons and Variety reported. Asia outside China is a market of its own, led by Japan's record year, and China is the hardest country to forecast because one local hit can move its total by a quarter.
Feature films produced worldwide
Film production hit an all-time high in 2024: 9,628 national feature films across 104 reporting economies, according to Omdia's film production database as published by WIPO. That beat 2019's pre-pandemic peak of 9,223 and recovered fully from the 2020 low of 5,490, when output fell 40%.
| Country | Feature films produced | Change on 2023 |
|---|---|---|
| India | 2,605 | n/a |
| Japan | 685 | +9 |
| China | 612 | -180 |
| United States | 544 | +34 |
| Italy | 350 | n/a |
| Mexico | 240 | n/a |
| Argentina | 235 | +63 |
| France | 231 | about flat |
| Türkiye | 223 | +76 |
Feature films produced by country, 2024
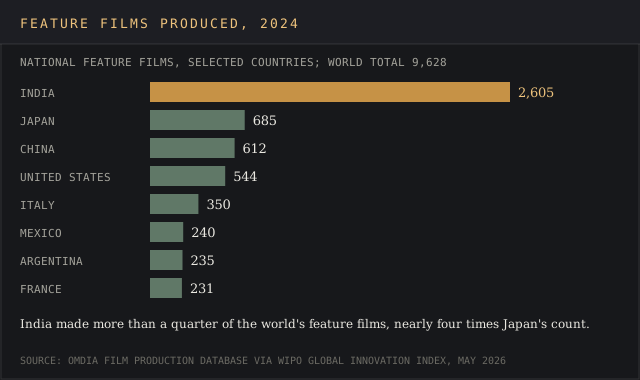
India's film industry dwarfs every other country by volume, with 2,605 films and over a quarter of the world total. Per head of working-age population, small countries lead: Bhutan made 28.6 films per million people aged 15 to 69, Mauritius 27.7 and Estonia 24.5. Brazil rose 22% to 197 films, and Uganda appeared in the data for the first time with 63.
The film production boom and the box office slump point in opposite directions. WIPO's authors note that streaming isn't covered by the production count, and that streaming content investment of about $42 billion in 2025 exceeded global box office of about $33 billion.
Counts of movies released wide in North America depend on the source. Cinema United, using Comscore data, counts 94 wide releases in 2024, 111 in 2025 and a projected 115 in 2026 in its December 2025 Strength of Theatrical Exhibition update. The Numbers, which counts differently, lists 169 movies released wide in 2025 against 130 in 2019, so by its measure more movies are released than before the pandemic, each selling fewer tickets.
Film production by country and the filmmakers behind it
Film production grew fastest in 2024 outside the usual centers. Türkiye's national film production rose by 76 titles to 223, up 52%, and it had made just 112 films in 2014, according to the Omdia data published by WIPO. Argentina added 63 films to reach 235, its best year in over a decade, Iran added 60 to reach 174, and Ukraine's filmmakers made 50 films, up from 16.
China moved the other way. Its film production fell by 180 titles, about 23%, to 612, while the United States added 34 films to reach 544. Global film production in 2024 was more than double the 2004 count, and the WIPO authors describe the period since as a production boom meeting a slower theatrical recovery.
- Latin America: Mexico 240 films, Argentina 235, Brazil 197, Colombia 79.
- Africa: Uganda 63, Nigeria 50, Malawi 44, with Egypt and Kenya also in the data.
- Per head: Bhutan, Mauritius, Estonia, Latvia (21.6 films per million working-age people) and Iceland (21.3).
Production volume and box office revenue measure different things. A country can make hundreds of films a year for local audiences, festivals and streaming while its movie theaters earn little, and a Hollywood studio can release 15 films and take a fifth of the North American market.
Read the two data sets together, with the date of each, and the film industry looks like two markets sharing one name: a global film production base of almost 10,000 titles a year and a theatrical market led by a few dozen franchise releases.
Theatrical windows: how long films stay in theaters first
Theatrical windows are stretching again. Wide releases reached first transactional video on demand after an average of 39 days in 2025, up from 36 in 2024, according to Omdia data reported by Celluloid Junkie. The top 10 North American films waited 51 days, up from 45, and the average gap to subscription streaming was a provisional 95 days.
Disney kept the longest window of the major studios, at 61.6 days to first rental or purchase in 2025. Short windows cost money at the box office: The Numbers estimated in an April 2025 Business Report that early home releases cost domestic theaters about $100 million a year.
Highest-grossing films and franchise titles
Franchises and family films ruled 2025. Four of the year's five biggest global grossers were family titles, Gower Street noted. Ne Zha 2 led the world; Zootopia 2 and Avatar: Fire and Ash, the two highest-grossing US films of the year, took a combined $1.8 billion globally in December alone, 52% of that month's box office.
Zootopia 2 earned $570 million in China, its biggest single territory, by the turn of the year. Demon Slayer: Infinity Castle took $779 million worldwide on Gower Street's count, over $500 million of it outside Japan.
2026 is a franchise year too, built on familiar stories. Brand New Day, which Sony Pictures Releasing distributed with Marvel, Toy Story 5 and The Super Mario Galaxy Movie are sequels or extensions of successful franchises, and Michael is a music biopic. The Odyssey, directed by Christopher Nolan and released by Universal, adapts Homer's epic and crossed $1 billion too. Avengers: Doomsday, a Disney and Marvel release, is due in December.
The film and television industry beyond the cinema
Theaters are now the smaller part of the film and television industry's revenue. US consumers spent $62.2 billion on home entertainment in 2025, up 17.4%, according to the Digital Entertainment Group's year-end report as summarized by Luminate. Subscription streaming made up $57.5 billion of that, 92.4%, and home video on disc kept shrinking, as it has for over a decade.
That's about seven times the North American box office. Worldwide, WIPO's authors count about 1.8 billion streaming subscriptions, annual revenue of over $100 billion for streaming services, and about $42 billion a year spent creating content.
The theatrical market still opens the sequence. BASE, the UK home entertainment trade body, describes buying and renting films as the "vital value bridge" from cinema to streaming services, and the UK home entertainment market hit a record £5.7 billion in 2025. The streaming statistics report covers the subscription side of the film and television industry in detail.
What movie theaters spend: investment, screens and costs
Cinema owners are spending to win audiences back. North American motion picture exhibitors reinvested more than $1.5 billion in their theaters between September 2024 and September 2025, according to Cinema United's Cinema Investment Report. One Texas chain, Santikos, put over $6 million into seats, concession remodels and new projectors in the second half of 2025 alone.
Those costs buy premium seats and screens for movie theaters, and they push up what audiences pay at the door. Cinema United represents 31,000 movie screens in the US and Canada and over 30,000 more in 80 countries, and says theaters employ about three people per screen in the US. The trade group's members range from AMC, Regal and Cinemark to community cinemas such as the Southampton Playhouse, which reopened in 2025 with four screens.
The cinema business has shrunk to fit its audiences. With about 38,000 US screens in 2024 and 754 million North American tickets in 2025, tickets fell 38% from 2019 and screens fell about 12% from 2020 to 2024, so the average screen sells fewer seats, and premium formats, loyalty programs and concessions make up the difference for theaters that survived.
Who works behind the camera
Women made up 23% of directors, writers, producers, executive producers, editors and cinematographers on the 250 top-grossing US films of 2025, unchanged from 2024, according to the Celluloid Ceiling report by Martha Lauzen at San Diego State University. In 1998 the figure was 17%.
- Directors: 13% of the top 250 films, down from 16% in 2024, and 10% of the top 100.
- Writers: 20%.
- Producers: 28%; executive producers: 23%.
- Editors: 20%, the same as in 1998.
- Cinematographers, the people running the camera department: 7%.
Lauzen's 2025 report also found that just 7% of the top 250 films employed 10 or more women in those roles, against 75% that employed 10 or more men. The 2024 edition found that films with at least one woman director employed more women in other key roles than films directed only by men.
On both sides of the camera the picture shifted: films with female protagonists fell from 42% in 2024 to 29% in 2025, according to Lauzen's It's a Man's (Celluloid) World study. A woman director on a Hollywood film is still the exception, the share of women filmmakers went backwards in 2025, and fewer of the stories on screen centered on women.
Who goes to the movies
Moviegoing is broad but uneven. 77% of Americans visited a movie theater in the 12 months to August 2025, and over 200 million people aged 12 to 74 saw at least one movie, according to National Research Group data in Cinema United's December 2025 update. Habitual moviegoers, who see six or more films a year, rose to 33% from 25% a year earlier.
Gen Z drives the frequency. Gen Z viewers went to the movies 6.1 times a year, up from 4.9, and 41% of them went at least six times, against 31% in 2022, per the same NRG data. Moviegoers aged 13 to 34 bought 73% of North American horror tickets in 2025, on Comscore's numbers. Theater loyalty clubs counted 136 million members in North America, up 15% since 2024. The Gen Z statistics report has the wider spending data behind those audiences.
Younger audiences rank the cinema highly. Audiences aged 10 to 24 named going to the movies as their top activity in 2025, ahead of concerts and sporting events, in UCLA's Teens and Screens report as cited by Cinema United. Parents with children aged 4 to 12 went 7.2 times a year, up from 6, per NRG. Those viewers are the audiences studios target with family films, which took four of 2025's five top global spots.
Audience data from recent releases
Exit surveys show how different each audience is. Toy Story 5's opening-weekend crowd was 57% female and 43% male, and the largest age group was viewers under 12, at 25%, followed by ages 25 to 34 (22%) and 35 to 44 (20%), The Numbers reported in June 2026. By ethnicity it was 37% Caucasian, 32% Hispanic, 13% African American and 9% Asian.
November 2026 releases skewed in opposite directions. Only 9% of Ebenezer's opening audience came as families and 59% were over 30, while 63% of How to Rob a Bank's audience was aged 18 to 34, per the same site. The Numbers' Business Report estimates that women aged 50 and over alone could be worth $221 million to $283 million a year at the box office.
The same source's model put the average ticket price at $12.27 for the second quarter of 2026, about 5% higher than in 2025, with attendance up about 10% on Q2 2025.
How box office data is collected
Box office data comes from a handful of sources, and knowing which one a figure comes from is half the battle. Each publishes on its own schedule and method:
- Comscore, through its Rentrak service, collects daily grosses from theaters, studios and distribution companies and is the base for most North American weekend reports.
- The Numbers and Box Office Mojo publish free domestic and worldwide charts by film, distributor and year.
- Gower Street Analytics, which partners with Comscore, estimates global box office monthly and forecasts the year ahead.
- Omdia counts films produced and box office revenue by country, published through WIPO.
- National bodies report their own markets: Eiren in Japan, Ormax Media in India, UNIC for European cinemas.
- EntTelligence and Placer.ai track ticket prices and foot traffic as a check on the revenue numbers.
A weekend gross published on a Sunday is a studio projection: The Numbers reported Ebenezer's $19.0 million opening on 15 November 2026 as a Paramount projection, with final figures due on the Monday. Keep an eye on the date shown alongside any weekend figure.
Access to box office data is split between free and paid, and the access level shapes which statistics get repeated. The Numbers and Box Office Mojo give free access to film-level charts by date, distributor, genre and country. Comscore's theater-level data, Gower Street's FORECAST service and Statista's charts sit behind paid access, and much of the box office statistics repeated online is copied from those paid sources without the original date.
When a figure has no named source and no date, treat it as unverified data.
What box office statistics cover, and what they leave out
Box office statistics measure one thing: money paid at movie theaters for a film's run. They leave out the rest of a film's revenue, from streaming licences to home video, television sales and merchandise, and they say nothing about production costs or profit. A studio can report a film's gross while its budget and marketing costs stay private, so a box office hit on the charts can still lose money for the studio that made it.
The data also covers theaters unevenly. North American theaters report every film every day, while some national totals arrive later: Japan's official annual figure covers December to November and was published at the end of January.
For the film industry, that means the most current data is always the North American data, and global statistics are estimates until each market's figures come in. Estimates move in recent years too: Gower Street projected $33 billion for 2025 in December 2024, raised that to $34.1 billion during the year, and closed 2025 at $33.55 billion.
Use the right measure for the question. For the health of movie theaters, use admissions and the number of theaters and screens. For studio performance, use distributor market share. For the size of the film industry as a whole, add box office revenue, home entertainment spending and streaming revenue, which together dwarf ticket sales.
Delivered for your site and your byline. Hosting here is optional.
Frequently asked questions
Which is the number one film industry in the world?
By revenue, the US and Canada: $8.87 billion of box office in 2025 against China's $7.4 billion, per Gower Street. By volume, India: 2,605 feature films produced in 2024, per Omdia.
Is it true that Gen Z goes to the movies the most?
Gen Z went 6.1 times a year in 2025 on NRG's data, and 41% went six or more times. Moviegoers aged 13 to 34 bought 73% of North American horror tickets.
Is 2026 a good year for box office?
Yes, by the trackers' numbers. Gower Street forecasts $34.7 billion globally, the best since 2019, the first half was the strongest of the decade, and five films had passed $1 billion each by late August.
Which movie is the biggest box office hit of 2026?
Spider-Man: Brand New Day, above $2.5 billion worldwide by late October 2026 according to Forbes, ahead of The Odyssey at nearly $1.8 billion.
What movie is number one at the box office right now?
For the weekend of 13 to 15 November 2026, Ebenezer was expected to open at number one with $19.0 million, a Paramount projection reported by The Numbers on 15 November, with final figures due on the Monday.
How much is the average movie ticket?
$11.31 in North America in 2025, per The Numbers' total box office divided by tickets. EntTelligence's average adult ticket was $13.46 through July 2026, and premium formats averaged $18.22.
How many movies are released each year?
The Numbers counts 169 movies released wide in North America in 2025. Worldwide, 9,628 feature films were produced in 2024, per Omdia.
Bottom line
The global box office is back to about $33.6 billion a year and forecast near $35 billion for 2026, still a fifth below 2019. North America sells far fewer tickets than before the pandemic and charges more for each one, and premium screens carry a growing share.
The rest of the world is uneven: Japan and India set records in 2025, Europe held flat, and China swings with a single local hit. For anyone using box office statistics, pick one tracker per series and quote its name and date. Anyone interested in where the money goes next should remember that production, streaming and the theatrical market now tell three different stories about the same film industry.
Studios, exhibitors and entertainment analytics firms publish reports like this one as lead magnets and client briefs.
A report on your topic for a blog page, gated content or a lead magnet.
Written for your client and published under their brand, with my name left off.
Your report on marketintelligencetools.com, with 2 to 3 CTAs carrying your sponsored links.
Default terms: the report is yours to publish, and I keep the right to republish it on this site behind a gate, outside Google's index.
Which tracker, trade body and newsroom each box office figure comes from, and the count no tracker keeps
Trackers and databases: gower.st (2025 year-end review, April 2026 revision, first-half 2026 review), the-numbers.com (market, genre and 2025 distributor tables; Business Reports), wipo.int (Omdia film production data for 2024), ormaxmedia.com (India box office report), luminatedata.com and baseorg.uk.
Trade bodies and research: cinemaunited.org (December 2025 update and Cinema Investment Report), womenintvfilm.sdsu.edu (Celluloid Ceiling and It's a Man's (Celluloid) World reports by Martha Lauzen) and celluloidjunkie.com (Omdia theatrical windows data).
Press coverage used where the tracker's own file was unavailable: forbes.com, fortune.com, au.variety.com, screendaily.com, bisnow.com (Reuters and S&P Global data), kfgo.com and irishnews.com (Reuters), thenightly.com.au (CNBC), opb.org (NPR), dailysabah.com (AP), english.adnkronos.com (Jiji Press), animenewsnetwork.com, filmibeat.com, cordcuttersnews.com, darkhorizons.com and finviz.com.
All figures checked 19 November 2026. None of the trackers above publishes a worldwide ticket count, so every admissions figure on this page is national.