Data breach statistics 2026: costs, counts and how a breach occurs
 By Jan Suski. I go deep on every review, checking every number against its source and digging up details other coverage misses, a habit from six years of SEO and link building for tech companies. Bylines at Surfer, Brand24, and Senuto. How the scoring works.
The numbers key takeaways from IBM, Verizon, the ITRC and HIPAA Journal, checked 17 October 2026
A U.S. breach costs about 2.3 times the $4.99 million global average cost, so a budget modeled on the global number undercounts American exposure by roughly $6.5 million per incident.
Breach counts and victim counts move independently: 3,322 compromises in 2025 produced fewer victim notices than 1,803 compromises in the first half of 2026.
Patching now matters more than password hygiene at the front door, since vulnerability exploitation passed stolen credentials as the top entry point in the 2026 DBIR.
Security vendors, MSSPs and cyber insurers quote breach numbers in every pitch. Send the industry or the country and I'll source a version you own.
The average data breach cost $4.99 million in 2026, a 12% rise and the highest figure in the history of IBM's Cost of a Data Breach Report. In the United States the same study puts the average breach cost at $11.5 million. Data breach counts are climbing too: the Identity Theft Resource Center logged 1,803 U.S. data compromises in the first half of 2026, on pace for about 3,600 by December.
This page collects the latest data breach statistics from the bodies that produce them: IBM's cost study, the Verizon Data Breach Investigations Report, the ITRC, an analysis of federal healthcare breach filings, Mandiant, CrowdStrike, Sophos, the FBI and two European trackers. Each figure links to its publisher and carries its study period, because a 2025 figure and a 2026 figure often sit side by side in the same search result.
It's written for security teams sizing a budget, compliance leads modeling fines, and analysts who quote data breach statistics in board decks. Those three groups read the same numbers for different reasons. A wrong average cost inflates a risk register by millions, and a stale attack-vector share sends money to the control that stopped last year's data breach.
Where these breach statistics come from
Five kinds of publisher produce nearly every data breach statistic in circulation, and the cyber security press recycles their figures for years. They measure different things, and most of the confusion in secondary roundups comes from treating a cost survey, a forensic caseload and a disclosure count as if they were one dataset.
IBM Cost of a Data Breach Report
IBM's annual study is the reference for breach cost. The 2026 edition, hot off the press on 29 July 2026, analyzed breaches at 602 global organizations in 17 industries between March 2025 and February 2026, according to IBM's newsroom. Each data breach in the sample is priced across four cost centers: detection and escalation, notification, post breach response and lost business.
Use it for budget modeling, cost per breach by industry or country, and the dollar effect of controls such as AI security automation. Its sample is breached organizations only, so it can't tell you how often a data breach happens.
Verizon Data Breach Investigations Report
The DBIR is the forensic view. The 19th edition covers incidents between 1 November 2024 and 31 October 2025, built from more than 31,000 incidents and over 22,000 confirmed breaches across 145 countries, per Verizon's executive summary. Its strength is attack-vector analysis: how threat actors got in, which actor types were involved and which patterns dominate each industry.
It's the right source for threat intel and tabletop planning. It publishes no average cost per breach.
Identity Theft Resource Center and breach trackers
The ITRC counts U.S. data compromises from public data breach notices filed under state breach laws. That makes it the best source for incident frequency and victim totals. Its weakness is transparency: only 24% of H1 2026 breach notices included any attack-vector detail, the lowest share the ITRC has recorded, according to its mid-year report.
HIPAA Journal healthcare breach dataset
This healthcare dataset analyzes the breach portal run by the Department of Health and Human Services Office for Civil Rights (OCR), which lists every breach of 500 or more records of protected health information. Its latest update, dated 15 October 2026, uses OCR data obtained on 10 October. For healthcare data breach statistics, this is the dataset closest to the regulator, straight from the horse's mouth.
CrowdStrike, Mandiant and Sophos research
Vendor research fills gaps the big three leave open. Mandiant's M-Trends 2026 (23 March 2026) reports dwell time from its incident response cases. The CrowdStrike 2026 Global Threat Report measures how fast intruders move once inside.
Sophos surveyed 2,158 ransomware victims in 17 countries for its State of Ransomware 2026. Each sample comes from the vendor's own customer base, so treat the shares as directional. All three track how threat actors behave once inside, which the cost studies don't.
Quick comparison of the main data breach reports
| Report | Sample | Period | Best for |
|---|---|---|---|
| IBM Cost of a Data Breach | 602 breached organizations | Mar 2025 to Feb 2026 | Global and country breach cost benchmarking |
| Verizon DBIR | 22,000+ confirmed breaches | Nov 2024 to Oct 2025 | Attack-vector statistics |
| ITRC | 3,322 U.S. compromises (2025) | Calendar year, plus H1 updates | U.S. data compromises counts and victim notices |
| HIPAA Journal | All 500+ record breaches reported to OCR | 2009 to August 2026 | Healthcare breach trends |
| Mandiant M-Trends | Mandiant incident response cases | Calendar 2025 | Dwell time, detection source |
| Sophos State of Ransomware | 2,158 ransomware victims | Prior 12 months | Ransom demands, payments, recovery cost |
Copy these lines into an email, fill them in and send. I reply with scope and a price within 2 to 3 business days.
Open the emailWhy the published data breach statistics disagree
Ask three publishers how a data breach starts and you get three different leaders. Verizon's DBIR says vulnerability exploitation opens 31% of breaches. Mandiant puts exploits at 32% of its intrusions, the top vector for the sixth year running. Sophos, surveying ransomware victims, puts malicious email first at 26% and exploited vulnerabilities fourth at 18%.
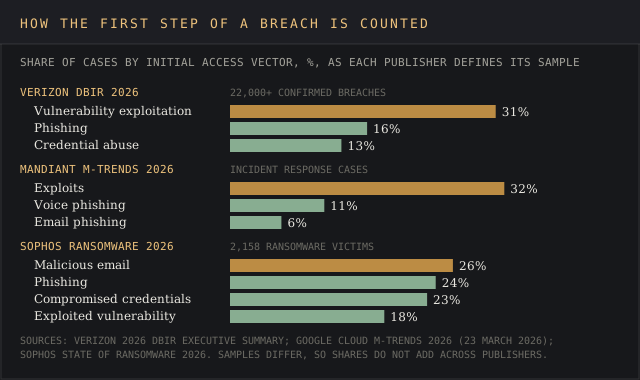
None of the three is wrong, and the devil's in the details. The DBIR counts confirmed breaches from dozens of contributors, Mandiant counts the hardest cases that reach its responders, and Sophos counts organizations already hit by ransomware. The sample decides the answer, which is why a single top attack vector figure means little until you know whose caseload it came from.
Cost figures split the same way. IBM's 2026 healthcare average of $6.64 million is a drop of 10.5% on its 2025 figure of $7.42 million, yet many 2026 roundups of healthcare data breach statistics still quote $7.42 million under a 2026 heading. The breach lifecycle shows the same lag: IBM's 2025 report said 241 days, the 2026 report says 247.
Counts diverge most of all. The ITRC's January 2026 annual report gave 278.8 million victim notices for 2025; its July update revised that to 297.5 million. Both are the ITRC's own numbers, published six months apart, and the later one is the one to use.
Cost of a data breach in 2026
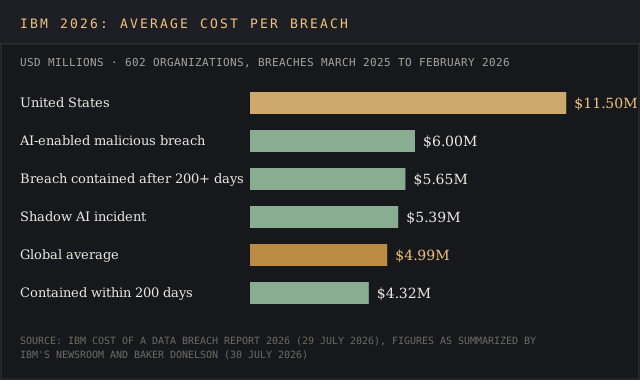
The cost of a data breach rose 12% to $4.99 million in IBM's 2026 report, reversing the 2025 dip to $4.44 million per data breach that IBM's 2025 release called the first decline in five years. Every number below comes from that 2026 study unless marked otherwise.
Want a cost chart like this for your own market? Send the country and the sector.
Email a briefGlobal average cost and U.S. average cost
The global average cost of a data breach was $4.99 million across 602 organizations. U.S. organizations averaged $11.5 million, up 11% on the year and more than double the global number, per Baker Donelson's summary of the full report. Every U.S. state and territory has had a data breach notification law since 2018, according to the ITRC, so a single U.S. data breach can trigger dozens of separate notice regimes.
Average breach costs by region
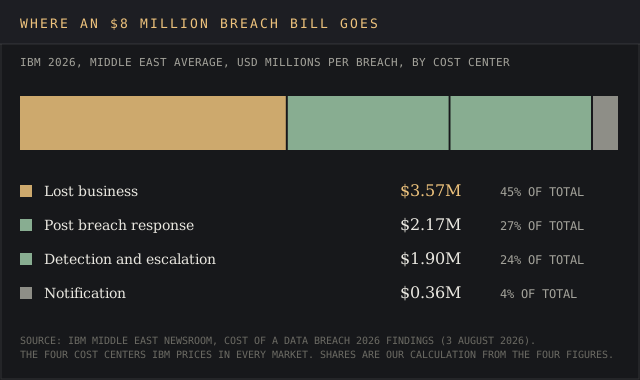
IBM's regional releases show the spread. The Middle East averaged $8 million per breach, according to IBM's Middle East newsroom (3 August 2026). The UK figure fell to £3.13 million from £3.29 million. India hit a record INR 255 million (INR 25.5 crore), up 15.9%, per IBM India.
| Market | Average cost of a data breach, 2026 | Change on 2025 | Source |
|---|---|---|---|
| United States | $11.5 million | +11% | IBM via Baker Donelson |
| Middle East | $8 million | n/a | IBM Middle East newsroom |
| Global | $4.99 million | +12% | IBM |
| United Kingdom | £3.13 million | -4.9% (from £3.29 million) | IBM UK newsroom |
| India | INR 255 million | +15.9% | IBM India newsroom |
Model a budget against the highest-cost market you operate in. A company with U.S. customers and a UK head office carries the American exposure, because notification law follows the residence of the person whose sensitive data was exposed.
Highest average breach costs by industry
Healthcare had the highest average breach costs for the 13th straight year at $6.64 million, even after its 10.5% fall, so healthcare providers still pay the most per data breach. Financial services followed at $6.29 million, up from $5.56 million, and energy averaged $5.2 million.
IBM's regional cuts reorder the list: in the Middle East, financial and technology firms tied at $10.67 million, and in the UK financial services led at £5.46 million.
Components that make up breach costs
IBM splits every breach cost into four buckets, and its Middle East release publishes the 2026 split in dollars:
- Lost business costs: $3.57 million per data breach, 45% of the total and the largest category.
- Post breach response: $2.17 million, 27%.
- Detection and escalation: $1.9 million, 24%.
- Notification: $0.36 million, 4%.
- The industry, region or attack type to cover
- Regions, years and segments
- Where it runs: blog, white-label, gated or lead magnet
- Whose byline goes on it
- Deadline
- 2,500+ words, human-written
- Every figure linked to its source
- Yours to publish, under your name or none
- Hosting here for +$200, with your sponsored links
Lost business takes the lion's share of the bill. Data recovery costs sit outside IBM's frame for ransomware victims: Sophos puts average recovery at $1.7 million per incident in its 2026 survey, before any ransom.
Cost drivers and how to reduce breach costs
Speed is the largest lever IBM measures. Breaches identified and contained within 200 days averaged $4.32 million; those that ran past 200 days averaged $5.65 million, a $1.33 million gap. The mean breach lifecycle grew 2.5% to 247 days in 2026, ending five years of improvement.
Automation is the second lever. Organizations that used AI and security automation extensively saved $1.93 million per breach compared with those using none, according to IBM's report page. The 2025 edition found the same tools cut 80 days from the breach lifecycle. In India, extensive users paid INR 213 million per breach against INR 316 million for organizations with no automation.
Shadow AI pushes the other way. A data breach involving unsanctioned AI tools cost $5.39 million in 2026, up from $4.63 million.
IBM India names noncompliance with regulations and cloud migration as further cost-increasing factors. On-premises data storage was involved in 30% of breaches, up from 20% two years earlier, and 53% of breached organizations didn't encrypt sensitive data at rest and in transit. A stitch in time saves nine: encryption is cheaper than the notification bill.
How many data breaches happen each year
The ITRC recorded 3,322 U.S. data compromises in 2025, up 5% from 3,152 in 2024 and 79% over five years. That beat the 2023 record of 3,202. When it rains it pours: the first half of 2026 brought 1,803 more, with Q2 alone at 1,029, the second-highest quarter in the ITRC's history.
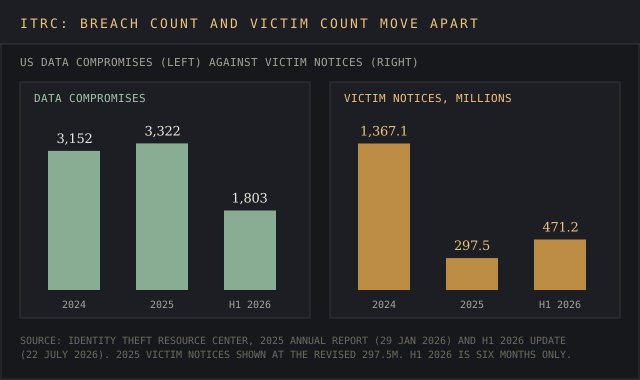
Victim totals tell a different story. Reported data breaches in 2024 generated 1.37 billion victim notices, driven by a few outsized breaches; 2025 fell 79% to 278.8 million in the annual report. Then H1 2026 hit 471.2 million, 58% of it from one data breach at Instructure, the company behind the Canvas learning platform, with an estimated 275 million victim notices.
Publicly traded companies were behind 10.3% of H1 2026 compromises and 83.4% of victim notices. By victim count, one data breach at a listed firm outweighs hundreds at small firms.
Europe counts differently and comes out higher per day. Regulators received an average of 443 breach notifications a day in the year to 27 January 2026, up 22% from 363, according to DLA Piper's GDPR survey (13 February 2026). That count covers personal data breaches notified to European data protection authorities, from a lost laptop to a full network intrusion.
The UK government's Cyber Security Breaches Survey 2025/2026 (30 April 2026) found 43% of UK businesses identified a breach or attack in the prior 12 months, rising to 65% of medium and 69% of large firms. Those are cybersecurity incidents of every size, from a phishing email to a full data breach.
For a wider count of cyberattacks beyond breaches, our cybersecurity statistics report covers FBI complaint totals, DDoS volumes and CVE records.
How a data breach occurs: attack vectors and initial access
A data breach occurs in stages: initial access, privilege escalation, lateral movement, then data theft or encryption. The first stage is where most data breach statistics are measured, and the 2026 numbers moved.
Vulnerability exploitation and stolen credentials
Exploitation of software vulnerabilities started 31% of breaches in the 2026 DBIR, the first time in 19 editions it passed stolen credentials. Credential abuse fell to 13%. The patching gap explains it: only 26% of critical vulnerabilities on CISA's Known Exploited Vulnerabilities list were fully remediated in 2025, down from 38%, and the median time to fix one rose from 32 to 43 days.
An exploited flaw lets threat actors compromise systems without touching an employee inbox. For a manufacturer the share is higher still: exploitation opened 38% of manufacturing breaches.
Phishing attacks and social engineering
Phishing held at 16% of initial access in the DBIR, unchanged on the year. The form is shifting toward phones. Mobile-centric phishing simulations drew median click rates 40% higher than email, and Mandiant saw voice phishing climb to 11% of intrusions while email phishing fell to 6%.
Social engineering attacks show up in the national surveys too:
- United Kingdom: phishing hit 38% of UK businesses in the government's survey on cyber security, the most common attack type, and was the most disruptive for 69% of those reporting a breach or attack.
- India: phishing including voice and SMS was the top vector at 19% in IBM's study.
Phishing attacks are par for the course in every dataset, and social engineering by phone is the channel growing fastest.
Business email compromise
Business email compromise is the costliest form of social engineering by reported loss. The FBI's 2025 Internet Crime Report logged 24,768 BEC complaints with $3.05 billion in losses, against 67,456 personal data breach complaints carrying $1.31 billion. A BEC scam is a malicious attack that needs no malware: a spoofed invoice and a rushed approver move the money.
Ransomware
Ransomware was present in 48% of breaches in the 2026 DBIR, up from 44%. Payments are shrinking. The median ransom paid fell to $139,875 from $150,000, and 69% of victims paid nothing. Against Sophos's $1.7 million average recovery cost, the ransom is a drop in the bucket.
IBM's 2026 study found 39% of organizations hit by ransomware, the fourth annual rise, with attackers pressuring victims by threatening brand reputation (41%), employee data (35%) and intellectual property (31%).
Sophos measures from the victim's side. Its 2026 survey puts the median ransom demand at $698,000 and the median payment at $769,000, with 48% of encrypted victims paying. Sophos publishes medians, so treat any average ransom demand quoted for 2026 with care; 48% of demands were $1 million or more.
Human error and insider threats
The DBIR found a human element in 62% of breaches, up from 60%. That covers clicked links, misdelivered email and misconfigured cloud storage. Miscellaneous errors, the pure human error pattern, accounted for 8% of breaches.
Insider threats vary by sector, and so does the mix of human error against malicious attack. Internal actors were behind 44% of public administration breaches, 22% in education and 19% in healthcare, against 5% in manufacturing and 1% in retail, per the DBIR. The ITRC counted 21 insider breaches tied to wrongdoing in H1 2026, up from 3 in all of 2025, a sevenfold jump and a red flag for access reviews.
AI systems and AI-enabled breaches
One in four malicious breaches in IBM's 2026 study was AI-enabled, a 56% increase on the year, and those breaches cost an average of $6 million. Deepfake impersonation led at 45% of AI-driven attacks, with AI-enabled malware and AI-generated phishing at 19% each. 62% of AI-driven attacks targeted critical infrastructure sectors.
Attacks on AI systems themselves are rising. More than 20% of organizations reported a breach targeting AI models or applications, most often through compromised APIs, apps or plug-ins (27%) and cloud misconfigurations affecting AI workloads (27%). Model inversion was the costliest AI model breach at $6.07 million.
Shadow AI is the internal risk vector. IBM found 43% of organizations had shadow AI incidents in 2026, up from 20%, and 92% of organizations with AI-related incidents lacked proper AI access controls.
The DBIR measured the same drift from the employee side: 45% of employees are regular AI users on corporate devices, up from 15%, and 67% reach AI services through non-corporate accounts.
Data leaks through prompts already show up in DLP logs: 3.2% of DLP policy violations involved uploading research or technical documents to unauthorized AI. DLP rules that skip AI uploads let these data leaks slip under the radar, and those data leaks can carry intellectual property as easily as customer records.
Threat actors are moving faster with the same tools. CrowdStrike reported an 89% increase in attacks by AI-enabled adversaries and an average eCrime breakout time of 29 minutes, with the fastest at 27 seconds. Our AI adoption statistics show how quickly sanctioned use is spreading, which sets the baseline unsanctioned use hides behind.
Controls for safe use of AI systems start with an inventory of which tools staff use, then approval rules for each access request to sensitive data, then logging of what leaves through prompts. IBM found only 19% of organizations reported coordination between AI governance and security teams, which leaves data leaks from AI tools with no clear owner.
Third-party and supply chain breach statistics
Third parties were involved in 48% of breaches in the 2026 DBIR, a 60% rise on the prior dataset. In manufacturing the share was 61%. Only 23% of third-party cloud MFA exposures were fully remediated.
The ITRC traced 280.6 million H1 2026 victim notices to supply chain attacks: 38 initial breach events at vendors spread to 206 downstream entities. One data breach at a shared provider multiplies into hundreds of disclosures, because each downstream customer files its own notice.
Healthcare shows the pattern at its worst. Conduent Business Services, a business associate, reported a 2025 hacking incident affecting 62,224,658 people, now the third-largest healthcare breach on OCR's list. Change Healthcare, also a business associate, holds first place at 192.7 million.
Spotting the one compromised supplier among hundreds is a needle in a haystack without continuous monitoring of vendor controls, which is the practical response:
- Track each supplier's exposed services and patch status.
- Watch every supplier's breach disclosures.
- Write remediation timeframes into contracts.
Our rankings of third-party risk management tools and supply chain risk management software compare platforms that score third party providers on that evidence.
Healthcare data breach statistics
Healthcare data breaches have affected 1,013,066,481 individuals since 2009, according to the count of breaches of 500 or more records reported to OCR. The total counts notices, so a patient whose medical records sat in three breached systems is counted three times.
- 2024: 741 breaches and more than 289 million individuals affected, a 58% rise on 2023, driven by Change Healthcare.
- 2025: about 138.5 million individuals affected.
- 2026: 252 breaches from 1 January to 30 April, about 9.5% fewer than the same period of 2025.
- Hacking and IT incidents: over 80% of large healthcare data breaches in 2025, against 49% in 2019.
- Business associates: 139 of 805 healthcare data breaches in the 2025 entity table, about 17%.
The three largest healthcare data breaches on record are Change Healthcare (192.7 million, 2024), Anthem (78.8 million, 2015) and Conduent Business Services (62.2 million, 2025). Two of the three healthcare data breaches hit business associates, which means healthcare providers inherit data breach risk from vendors that never see a patient.
ITRC data agrees on direction. Healthcare logged 281 compromises in H1 2026, up on the prior year and reversing a slight downward trend. Verizon's healthcare snapshot counts 1,438 confirmed breaches, with exploitation of vulnerabilities at 20% of initial access, phishing 14% and credential abuse 11%, and third-party involvement in 32%.
Healthcare organizations face a regulator with a long memory. OCR imposed 21 HIPAA penalties on healthcare providers and other covered entities in 2025.
As of 31 January 2026, OCR had closed 11 hacking investigations with penalties for HIPAA risk analysis failures, the Security Rule violation it cites most often. For healthcare organizations that hold protected health information, a missing risk analysis turns a data breach into a penalty.
For healthcare cybersecurity budgets at hospitals and other healthcare providers, the cost figure to use is IBM's $6.64 million average for healthcare data breaches. Our guide to healthcare market intelligence covers the vendors serving healthcare providers in the healthcare industry, and the EHR statistics report shows how much patient data now sits in electronic records.
Data breaches by industry
Industries rank differently by frequency and by cost. Financial services tops the ITRC's 2025 count and ranks second to healthcare on IBM's cost list. Manufacturing carries the largest swing in victims.
| Industry | U.S. compromises, 2025 (ITRC) | Average breach cost, 2026 (IBM) | Notable 2026 figure |
|---|---|---|---|
| Financial services | 739 | $6.29 million | 387 compromises in H1 2026, most of any sector |
| Healthcare | 534 | $6.64 million | 281 compromises in H1 2026 |
| Professional services | 478 | n/a | Fastest growth in the ITRC's 2025 count |
| Manufacturing | 299 | n/a | 74 million victim notices in H1 2026 against 1.97 million in all of 2025 |
| Education | 188 | n/a | 22% of breaches involve internal actors (DBIR) |
| Energy | n/a | $5.2 million | UK energy breaches averaged £4.03 million |
Manufacturing and critical infrastructure
Manufacturing logged 3,627 incidents and 2,713 confirmed breaches in the 2026 DBIR, with espionage the motive in 15%. Third parties were involved in 61% of manufacturing breaches, and exploitation opened 38%, both above the all-industry figures. The ITRC's 74 million manufacturing victim notices in H1 2026 compare with 1.97 million in all of 2025.
Utilities saw espionage in 71% of breaches per the DBIR. Combined with IBM's finding that 62% of AI-driven attacks hit critical infrastructure sectors, the sector needs vendor hardening, segmented OT networks and a tested restore plan before the next outage.
Financial institutions are covered in our financial market intelligence guide, and government breach exposure in the public sector guide.
Detection, containment and recovery metrics
Four numbers describe how quickly a breach gets caught:
- 247 days: IBM's mean time to identify and contain in 2026; multi-location breaches took 256.
- 14 days: Mandiant's global median dwell time in 2025, up from 11.
- 52%: share of Mandiant's 2025 investigations first detected internally, up from 43%.
- 29 minutes: CrowdStrike's average eCrime breakout time, 65% faster than in 2024.
IBM and Mandiant measure different things. IBM's 247 days runs from intrusion to containment across all breached organizations; Mandiant's 14 days is the median gap between intrusion and discovery in cases its responders worked. Both moved the wrong way in the latest editions.
CrowdStrike's 1-10-60 rule gives security teams a target: one minute to detect, ten minutes to investigate and 60 minutes to remediate, as the company's blog defines it. Against a 29-minute breakout, a team that takes an hour to investigate is racing against the clock and losing. Patching a KEV-listed flaw before it's used is how teams nip the problem in the bud.
Automation shortens identification more than containment. In India, IBM found organizations with no automation took 236 days to identify and 75 to contain, against 175 and 81 days for extensive users.
Time to identify and contain a breach in India
Source: IBMe.g. containment times in your sector
Source: linked, checked, datedManaged detection and response (MDR) services close part of that gap for security teams without a 24-hour operations center, and IBM India lists proactive threat hunting among its top cost-reducing factors, the service managed detection providers run around the clock.
Track these KPIs in an incident-response playbook: time to detect, time to contain, share of alerts triaged within an hour, percentage of KEV-listed vulnerabilities patched by CISA's due date, and number of tabletop exercises run per year. Our ranking of cyber threat intelligence tools covers the feeds that shorten the first of those numbers.
Regulatory fines, financial penalties and victim costs
Financial penalties land after the incident response bill. European regulators issued about €1.2 billion in GDPR fines in the year to January 2026, roughly flat on the year, per DLA Piper; the Irish Data Protection Commission alone has fined €4.04 billion since May 2018. Nine of the ten largest GDPR fines went to big technology and social media companies.
U.S. settlements run to multi-million dollar fines too:
- Equifax agreed to pay at least $575 million, potentially up to $700 million, over a 2017 breach affecting about 147 million people, per the Federal Trade Commission.
- State attorneys general secured $49.5 million from Blackbaud in a 2023 multistate settlement, per the same healthcare dataset.
More than one in five organizations with shadow AI incidents paid a regulatory fine in IBM's 2026 study.
Victims carry costs of their own. The ITRC's consumer survey of 1,040 people found 80% received a breach notice in the prior 12 months and 88% of recipients suffered at least one consequence: 40% saw more phishing attempts and 40% faced an attempted account takeover. Immediate financial fraud is the primary fear for 50%, and consumer data exposed once keeps feeding phishing for years.
The FTC's breach response guide tells companies to "consider offering at least a year of free credit monitoring or other support," particularly where Social Security numbers were exposed, and to point victims to IdentityTheft.gov.
Companies that bite the bullet and notify fast give victims a head start; the FTC notes that people told quickly "can take steps" to limit the damage. That credit monitoring line item sits in IBM's post breach response bucket. The financial impact on the victim runs for years after the notice letter, since compromised data stays in circulation.
How to use breach statistics to improve your cyber security
Data breach statistics earn their keep when they change a budget line. Map each figure to a decision before the next round of security spending.
Start with expected loss. Take IBM's average cost for your country and industry, adjust for your record count, and compare it with what each control costs. A $1.93 million saving from extensive AI security automation, against a $4.99 million average breach, sets the ceiling a CFO will accept for that spend. Last year's figure is close but no cigar, so refresh the inputs every July when IBM publishes.
Then prioritize by vector. With exploitation at 31% of breaches and median patch times at 43 days, vulnerability management deserves budget ahead of another awareness module. Run tabletop exercises built on the top three vectors in your sector's DBIR snapshot, and schedule a breach-cost tabletop within 90 days.
Choose by organization size, industry and risk appetite
Small and midsize businesses face ransomware out of proportion to their size, per the DBIR, and UK data shows 42% of micro and 46% of small businesses identified a breach or attack. Offline backups, multifactor authentication and a written incident response plan come first. Our small business statistics report covers what those firms spend.
Enterprises should weigh security AI and managed detection against IBM's cost curve: the 200-day line is worth $1.33 million per data breach. IBM's May 2026 follow-on found 85% of organizations plan to increase security spending after learning of frontier AI cyber capabilities, against 64% who planned increases after a data breach.
Regulated sectors such as healthcare and financial services should model a worst-case breach with regulatory fines added, using HIPAA penalties and GDPR's 4%-of-turnover ceiling as the upper bound.
Three security practices recur across every report: patch internet-facing systems by the KEV due date, monitor vendors continuously, and keep an eye on AI tools staff use without approval. Security leaders who show the board those three numbers each quarter have a measurable security posture to defend, and a cyber security budget tied to evidence.
Buy security tools against that baseline and each purchase maps to a number the board already tracks. Our risk intelligence software ranking covers the platforms that track them.
Which data breach report to use
- Choose IBM's cost study for cost modeling, regional comparisons and the value of security tools.
- Choose the Verizon DBIR for attack-vector guidance and industry snapshots.
- Choose the ITRC for U.S. incident frequency and victim counts.
- Choose the OCR-based healthcare dataset for healthcare breach intelligence, penalties and the largest breaches of protected health information; it also suits medical research groups that hold patient records.
- Choose Mandiant M-Trends and CrowdStrike for dwell time and breakout speed.
One data breach report never covers everything, and putting all your eggs in one basket is how a cost model ends up built on a forensic caseload. Each source also describes a different security posture: IBM's sample was breached, the DBIR's was investigated, the ITRC's was disclosed. Pair one cost source with one frequency source and one attack-vector source.
Delivered for your site and your byline. Hosting here is optional.
Frequently asked questions
What is the average cost of a data breach?
The global average cost of a data breach was $4.99 million in IBM's 2026 report, covering breaches between March 2025 and February 2026. U.S. organizations averaged $11.5 million.
What is the average cost of a data breach in 2026?
$4.99 million globally, up 12% from $4.44 million in the 2025 edition and the highest in the report's history. Healthcare averaged $6.64 million and financial services $6.29 million.
What is the average cost of a security breach for a small business?
IBM doesn't publish a small-business average. The UK government survey found the median perceived cost of a business's most disruptive breach was £0, with the 95th percentile at £4,000. For a breach involving stolen data, IBM's averages are the better benchmark.
What is the 1-10-60 rule in cybersecurity?
It's CrowdStrike's response benchmark: detect an intrusion within one minute, investigate within ten and remediate within 60. It matters because CrowdStrike's 2026 average breakout time was 29 minutes.
Where do most cyber incidents begin?
The DBIR found a human element in 62% of breaches, from human error to social engineering. By initial access, vulnerability exploitation leads at 31%, followed by phishing at 16% and credential abuse at 13%.
How many data breaches happen per year?
The ITRC counted 3,322 U.S. data compromises in 2025, a record, and 1,803 in the first half of 2026. European regulators received 443 breach notifications a day in the year to January 2026.
What are the largest data breaches of all time?
By victims, Instructure's Canvas data breach generated an estimated 275 million victim notices in 2026. In healthcare, Change Healthcare (192.7 million), Anthem (78.8 million) and Conduent (62.2 million) lead the OCR list. Equifax's 2017 breach affected about 147 million people.
Where can I check for a major data breach today?
The ITRC's tracker and the HHS OCR breach portal post new data breach notices as they're filed. Those OCR listings are the first public record of most healthcare data breaches, and of the data theft behind them.
Bottom line
Every data breach series moved the wrong way in 2026. IBM's average breach cost hit a record $4.99 million and $11.5 million in the U.S.; the ITRC is on pace for about 3,600 compromises; the lifecycle stretched to 247 days. Exploited vulnerabilities now open more breaches than stolen passwords, and one in four malicious breaches used AI.
The spread between publishers is the part most roundups skip. A cost survey, a forensic caseload and a disclosure count answer different questions, so match the source to the decision before quoting a number. Read between the lines on sample and period, and the figures stop contradicting each other.
The key takeaways for budgets are the figures with dollars attached: $1.33 million for slow containment, $1.93 million saved by automation, $6 million for an AI-enabled breach. Those three data breach statistics tell a security team where the next dollar goes.
Security vendors, MSSPs and cyber insurers publish reports like this one as lead magnets and client briefs.
A report on your topic for a blog page, gated content or a lead magnet.
Written for your client and published under their brand, with my name left off.
Your report on marketintelligencetools.com, with 2 to 3 CTAs carrying your sponsored links.
Default terms: the report is yours to publish, and I keep the right to republish it on this site behind a gate, outside Google's index.
The cost studies, breach trackers and regulator filings behind each figure, and the numbers none of them publish
Cost: ibm.com (Cost of a Data Breach Report 2026 page), newsroom.ibm.com (29 July 2026 global release; 30 July 2025 release for the 2025 baseline), mea.newsroom.ibm.com (3 August 2026), uk.newsroom.ibm.com and in.newsroom.ibm.com (2026 country releases), and bakerdonelson.com (30 July 2026 summary, the source for the U.S., healthcare, financial services and lifecycle figures).
Counts and attack vectors: idtheftcenter.org (2025 annual report, 29 January 2026; H1 2026 report, 22 July 2026), verizon.com (2026 DBIR release of 19 May 2026 and its executive summary), hipaajournal.com (healthcare dataset updated 15 October 2026 from OCR data of 10 October), cloud.google.com (Mandiant M-Trends 2026, 23 March 2026), crowdstrike.com (2026 Global Threat Report and the 1-10-60 post), sophos.com (State of Ransomware 2026).
Government, regulators and courts: ic3.gov (2025 Internet Crime Report), dlapiper.com (GDPR survey, 13 February 2026), gov.uk (Cyber Security Breaches Survey 2025/2026, 30 April 2026) and ftc.gov (Equifax settlement, July 2019; data breach response guide).
Every figure was checked against its source on 17 October 2026. IBM publishes no small-business average cost, Verizon publishes no cost per breach, Sophos publishes ransom medians with no average, and only 24% of the ITRC's H1 2026 notices named an attack vector, so any figure on another site that fills those gaps is a model.