Job market statistics 2026: payrolls, unemployment, openings and pay
 By Jan Suski. I go deep on every review, checking every number against its source and digging up details other coverage misses, a habit from six years of SEO and link building for tech companies. Bylines at Surfer, Brand24, and Senuto. How the scoring works.
The numbers US labor market, checked 7 October 2026
Job growth averaged 45,000 a month over the 12 months before September.
The jobless rate hasn't left the 4.1% to 4.3% band since March.
BLS reads the quit rate as a sign of workers' willingness or ability to leave jobs, so a 1.9% rate says few feel able to.
The U.S. added 29,000 payroll jobs in September 2026 and the unemployment rate sat at 4.2%, according to the Bureau of Labor Statistics Employment Situation report published on 2 October 2026. That's the labor market in two numbers: slow job creation, steady unemployment.
The slow part goes back a long way. Payrolls grew by 116,000 across all of 2025 on current BLS data, then by 612,000 from January to September 2026. Hiring runs below its 2019 pace, layoffs run below it too, and the result is an economy where fewer people lose jobs and fewer people find new ones.
This page collects current job market stats for the United States: monthly payrolls, the unemployment rate and who it hits, labor force participation, job openings and quits, wages, job cuts and the official outlook. Every number links to the agency or research house that published it, dated to the release. It's written for analysts, hiring teams and job seekers who need a figure they can defend in a meeting.
The U.S. job market in September 2026
BLS called both headline numbers little changed. Payrolls rose 29,000 and the unemployment rate ticked up by a hair's breadth, from 4.1% to 4.2%. The technical note puts the 90% confidence interval on a monthly payroll change at plus or minus 122,000, so a 29,000 gain can't be told apart from zero.
The same report cut the prior two months by a combined 60,000: July went from +21,000 to -10,000 and August from +162,000 to +133,000. Revisions like that are par for the course in 2026. BLS revises each month twice as late reports arrive from businesses and government agencies, so the number on jobs Friday is the least accurate one it'll publish for that month.
The September details, from the same release:
- Health care added 17,000 jobs, construction 11,000 and manufacturing 9,000.
- Financial activities lost 7,000 and the information sector lost 10,000.
- Private payrolls rose 46,000 while public payrolls fell 17,000.
- The average workweek held at 34.4 hours, and hourly pay rose 5 cents.
- 4.5 million employed workers held part-time jobs because they couldn't get full-time hours.
Monthly payrolls and unemployment, January 2025 to September 2026
The month-by-month record shows how weak 2025 was once revisions landed. The table uses the BLS series as of the 2 October 2026 release, so early 2025 months differ from what was first reported. Payroll changes are in thousands, and the jobless rate is the household survey reading.
| Month | Payroll change 2025 (thousands) | Payroll change 2026 (thousands) | Jobless rate 2025 | Jobless rate 2026 |
|---|---|---|---|---|
| January | -48 | +160 | 4.0% | 4.3% |
| February | +42 | -156 | 4.2% | 4.4% |
| March | +67 | +214 | 4.2% | 4.3% |
| April | +108 | +148 | 4.2% | 4.3% |
| May | +13 | +63 | 4.3% | 4.3% |
| June | -20 | +31 | 4.1% | 4.2% |
| July | +64 | -10 | 4.3% | 4.1% |
| August | -70 | +133 | 4.3% | 4.1% |
| September | +76 | +29 | 4.4% | 4.2% |
| October | -140 | due 6 November | not collected | due 6 November |
| November | +41 | due 4 December | 4.5% | due 4 December |
| December | -17 | due January 2027 | 4.4% | due January 2027 |
Source: BLS Current Employment Statistics and Current Population Survey data via the St. Louis Fed's FRED database, through 2 October 2026; release dates from the BLS schedule.
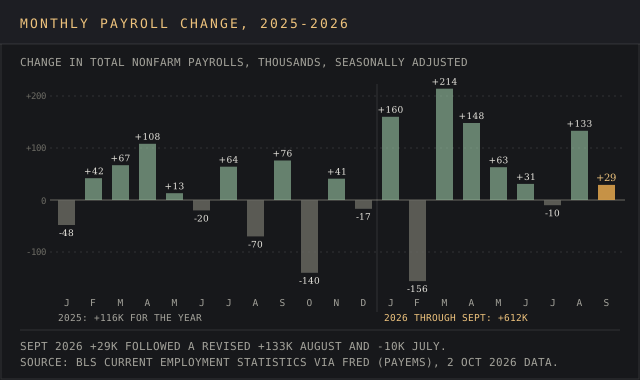
The three-month trend tells the same story with less noise. Payrolls averaged +51,000 a month from July to September 2026, compared with +23,000 over the same three months of 2025.
The 2025 job market: full-year numbers
When BLS published January 2026 data on 11 February, it wrote that payroll employment changed little in 2025, averaging 15,000 a month. Later seasonal revisions trimmed the December-to-December gain to 116,000. The same release carried the annual benchmark, which lowered the March 2025 payroll level by 898,000 after BLS checked it against unemployment insurance tax records.
Three forces shaped the year:
- Federal job cuts. Challenger's December 2025 report counted 293,753 cuts tied to DOGE actions and 308,167 public-sector cuts in total. Federal payrolls fell from 2.914 million in September 2025 to 2.682 million a year later.
- Announced cuts across the private sector. Employers announced 1,206,374 job cuts in 2025, up 58% from 761,358 in 2024 and the highest total since 2020. Planned hires fell 34% to 507,647.
- Health care carried the gains, averaging 33,000 new jobs a month while construction stayed flat.
Unemployment drifted up from 4.0% in January 2025 to a 4.5% peak in November. The October 2025 household survey was never collected because of the government shutdown, so that month has no jobless rate at all.
Unemployment rate and who is out of work
The unemployment rate counts people without a job who looked for one in the past four weeks, as a percentage of the labor force. At 4.2% it sits above the 3.4% recorded in April 2023, the lowest since May 1969, and far below the 14.8% pandemic peak of April 2020.
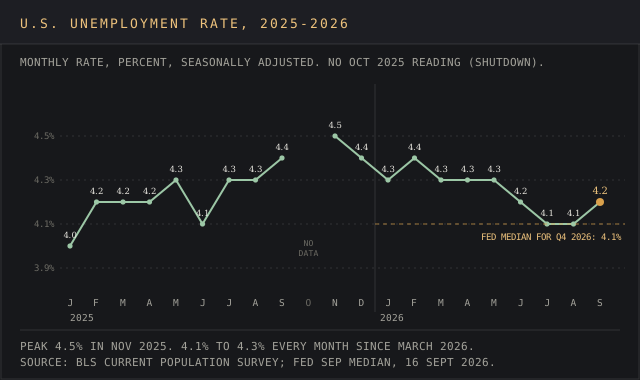
The headline rate hides wide gaps. September 2026 rates by group, from BLS household survey data published through FRED:
- Workers aged 16 to 24: 9.9%, down from 10.4% a year earlier.
- Black workers: 7.0%. Hispanic workers: 4.7%. White workers: 3.6%.
- By education, adults with a bachelor's degree or higher: 2.5%. Some college or an associate degree: 4.4%.
- The broader U-6 rate, which adds involuntary part-timers and marginally attached workers: 7.6%, down from 8.7% in November 2025.
Duration is the red flag in the labor market data. In March 2026, 7.24 million Americans were unemployed and 1.82 million of them had been out of work for 27 weeks or longer. By September that long-term group was 1.94 million, 27.1% of all unemployed Americans, compared with 20.2% in December 2019.
Claims for unemployment benefits tell a calmer story about the economy. The Labor Department counted 197,000 initial claims in the week ending 26 September 2026, with 1.70 million people on continuing benefits the week before. Few new people enter the pool, and those in it leave slowly.
Unemployment by state
South Dakota had the lowest state rate in August 2026 at 2.0%, followed by North Dakota at 2.2%, according to the BLS state release of 18 September. California, Connecticut and Oregon tied for the highest state rate at 5.1%, and the District of Columbia was higher at 5.7%. Ohio's 3.3% was its lowest since the series began in 1976.
Local news reports on a state's jobless rate draw on this release. BLS builds the state rates with statistical models fed largely by household survey data, so a state's monthly change needs to be larger than a national one before BLS calls it significant.
Labor force participation and how many people work
The labor force participation rate was 61.8% in September 2026, down from 62.5% a year earlier and 63.3% in February 2020. Payroll employment, a separate count of jobs in the economy, stood at 159.0 million, about 6.8 million above its February 2020 level.
| Household and payroll counts | September 2025 | September 2026 |
|---|---|---|
| Civilian population 16 and over, millions | 274.2 | 275.6 |
| Civilian labor force, millions | 171.3 | 170.3 |
| People with a job (household survey), millions | 163.7 | 163.2 |
| People without a job and looking, millions | 7.6 | 7.1 |
| Jobless 27 weeks or more, millions | 1.8 | 1.9 |
| Part-time for economic reasons, millions | 4.6 | 4.5 |
| Not in the labor force, millions | 103.0 | 105.3 |
| Women in the labor force, millions | 80.6 | 80.9 |
| Payroll jobs, all industries, millions | 158.5 | 159.0 |
| Private payroll jobs, millions | 135.0 | 135.7 |
| Labor force participation rate | 62.5% | 61.8% |
| Employment-population ratio | 59.7% | 59.2% |
Part of the drop in the labor force came from a statistical adjustment that slipped under the radar. In March 2026 BLS folded in new Census Bureau population estimates reflecting a decline in net international migration, and the February 2026 release says that change alone cut the labor force by 1.4 million and the labor force participation rate by 0.4 percentage point. The unemployment rate wasn't affected.
Participation by group, September 2026:
- Prime working age, 25 to 54: 83.7%, above the 82.9% of February 2020.
- Men 20 and over: 69.4%. Women 20 and over: 58.0%.
- Women make up 80.9 million of the 170.3 million in the workforce, or 47.5%.
The employment-population ratio, the share of everyone 16 and older with a job, was 59.2% in both March and September 2026, so just under 6 in 10 adults work. In June 2026, 105.8 million people were outside the labor force, 38.5% of the population aged 16 and over, and in September 5.8 million people outside it said they wanted a job.
Job openings, hires, quits and layoffs
Employers had 7.1 million job openings at the end of August 2026, a rate of 4.3%, according to JOLTS. That's close to the 7.15 million monthly average of 2019 and far below the 12.3 million peak of March 2022. Openings fell to 6.55 million in December 2025 before rising again.
| JOLTS measure | August 2026, millions | 2019 average, millions | Rate, August 2026 | Rate, 2019 average |
|---|---|---|---|---|
| Job openings | 7.08 | 7.15 | 4.3% | 4.5% |
| Hires | 5.19 | 5.83 | 3.3% | 3.9% |
| Quits | 3.07 | 3.51 | 1.9% | 2.3% |
| Layoff and discharge | 1.64 | 1.82 | 1.0% | 1.2% |
Levels in millions, rates as a share of employment. Source: BLS JOLTS via FRED, data through August 2026.
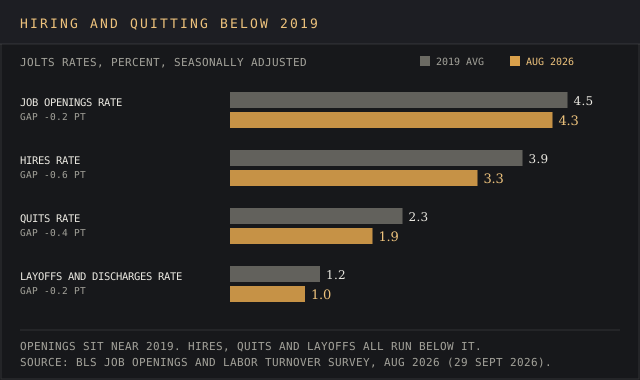
Hires ran 11% below the 2019 monthly average, and the quit rate peaked at 3.0% in 2022 before falling under pre-pandemic levels. The layoff rate of 1.0% is lower than 2019's too. In August there were 7.1 million openings for 7.0 million jobless people, roughly one each, so the wait for an offer runs longer than the openings count would suggest.
Indeed's economists call this a low-hire, low-fire environment that's prevailed since 2025, and the Indeed Job Postings Index stood at 101 in August 2026, just above its February 2020 baseline of 100. Postings and openings sit close to their 2019 marks, a sign of flat labor demand, and the weak hires rate is the clearest sign that the trend favors people who already have jobs.
Announced job cuts in 2026
Challenger, Gray & Christmas tracked 43,281 announced job cuts in September 2026, down 20% from September 2025. Year-to-date cuts of 573,195 are 39% below the 946,426 of the first nine months of 2025, and 15% lower once public-sector cuts are excluded.
Artificial intelligence was the most-cited reason for cuts in 2026 so far, named in 120,136 announcements, about 21% of the total. Seasonal recruiting sat on the back burner: companies announced 90,787 hiring plans in September, the lowest September since 2011. The AI count is worth reading between the lines: it records the reason a company gave in its announcement, and the AI statistics report on this site tracks adoption and job exposure separately.
Wages, the employment cost index and inflation
Average hourly earnings for private employees rose 3.0% over the year to September 2026, to $37.81. That matches the 3.0% pace of 2019 and trails the 3.7% of 2025, so wage growth is back at pre-pandemic levels.
Prices rose faster. The consumer price index rose 3.4% in the year to August 2026, per BLS, and the real earnings release puts price-adjusted hourly pay 0.3% lower than a year earlier. Real weekly pay rose 0.3% only because the average workweek got longer.
Three other wage measures, each built differently:
- The employment cost index rose 3.4% in the year to June 2026, with wages and salaries up 3.2% and benefits up 3.8%. It holds the job mix fixed, so cuts to low-paid jobs don't move it.
- The Atlanta Fed Wage Growth Tracker, a median of individual pay changes, was 4.1% in August 2026, up from 3.8% in July.
- Job switchers earned 5.0% more on the Atlanta Fed measure and job stayers 3.6%, a 1.4-point premium for moving.
The switcher premium explains part of the frustration in this labor market. Moving pays, but with quits at 1.9% fewer people manage to move, and those who stay take the risk of falling behind prices.
Industries adding and cutting jobs
Health care is the one sector that has grown through the labor market slowdown. Health care and social assistance added 520,000 jobs in the year to September 2026, more than the 496,000 net gain for all payrolls, and employed 23.96 million people. Private healthcare and social assistance is expected to add 2.2 million more jobs by 2035. The nursing shortage figures show where that demand presses hardest.
| Sector | September 2025, millions | September 2026, millions | Change (thousands) |
|---|---|---|---|
| Health care and social assistance | 23.44 | 23.96 | +520 |
| Professional and business services | 22.36 | 22.48 | +123 |
| Construction | 8.26 | 8.36 | +109 |
| Leisure and hospitality | 16.91 | 16.97 | +62 |
| Other services | 6.01 | 6.04 | +34 |
| Financial activities | 9.19 | 9.08 | -107 |
| Information | 2.86 | 2.74 | -120 |
| Federal | 2.91 | 2.68 | -232 |
Source: BLS table B-1, seasonally adjusted, 2 October 2026.
The largest single occupations come from a different BLS program. Home health and personal care aides were the most common job in America in May 2025 at 4.3 million, followed by retail salespersons and fast food and counter workers at 3.9 million each, per the Occupational Employment and Wage Statistics release. Eight of the 10 largest occupations paid below the $69,770 national average wage.
Why the payroll survey, household survey, ADP and JOLTS disagree
Every month at least five sources put a number on the labor market, and in September 2026 they told five different stories. Each measures something else.
| Source | What it counts | Latest reading | Sample behind it |
|---|---|---|---|
| BLS payroll survey (CES) | Jobs on employer payrolls | +29,000 total, +46,000 private, September 2026 | About 119,000 businesses and agencies |
| BLS household survey (CPS) | People with any job, self-employed included | +406,000 people with a job, September 2026 | About 60,000 households |
| ADP National Employment Report | Private payroll jobs at ADP clients | +90,000 private, September 2026 | Payroll records of 26 million employees |
| BLS JOLTS | Openings, hires and separations | 5.2 million hires, 5.1 million separations, August 2026 | About 21,000 establishments |
| Challenger, Gray & Christmas | Job cuts employers announce | 43,281 cuts, September 2026 | Public announcements |
The payroll and household surveys diverge most. The household survey counts people, so a worker with two jobs counts once, and it includes the self-employed and farm workers the payroll survey leaves out. Its 60,000-household sample is far smaller than the payroll survey's, so its monthly changes swing more.
ADP's +90,000 measured private jobs at its own clients, against the BLS private count of +46,000. JOLTS counted 5.2 million hires and 5.1 million separations in August, a flow measure that never maps neatly onto the payroll change. The devil's in the details. BLS's 898,000 benchmark cut showed which reading was accurate for the year to March 2025, a year after the fact.
Two more breaks in the record matter for anyone comparing 2025 with 2026. The shutdown erased October 2025's household data, and the March 2026 Census adjustment lowered the labor force by 1.4 million at a stroke.
Outlook for the job market in 2026 and beyond
The Federal Reserve expects unemployment to finish 2026 at 4.1%, the median of officials' projections on 16 September, down from 4.3% in June. The same projections put 2026 economic growth at 2.3% and PCE inflation at 3.7%. The jury's still out on that path, since the unemployment median moved 0.2 point in three months. The committee raised its target range by a quarter point to 3.75% to 4% that day, writing that job gains have kept pace with the workforce.
That rate decision is why financial markets treat jobs Friday as a market event. Investors read a strong payroll print as raising the odds of another hike, which moves Treasury yields and any bond portfolio priced off them. Investors also watch the trend in wages, with 3.0% hourly earnings growth suggesting less pay pressure on services prices than the 3.7% of 2025.
Employers and consumers read the labor market as softening:
- In the Conference Board's September survey, 23.6% of consumers said jobs were plentiful and 21.9% of consumers said jobs were hard to get, a gap of 1.7 points, down 2.5 points from the prior month.
- The NFIB September jobs report found 32% of small businesses with openings they couldn't fill, down 3 points, and a net 17% planning to add jobs.
- Andy Challenger, chief revenue officer at Challenger, Gray & Christmas, said in the firm's 1 October release that "Companies are in a wait-and-see period right now," citing energy costs, the rate hike and healthcare costs.
The consumers' reading of a cooling labor market matches the hiring data, suggesting households feel the slower churn before the jobless rate shows it.
Over a decade, BLS's 2025-2035 projections put total employment at 176.2 million in 2035, up 5.9 million or 3.5%, against 10.9% growth in the decade before. Data scientists (+34.6%) and solar photovoltaic installers (+36.5%) rank among the fastest-growing occupations, and retail trade is expected to lose 27,500 jobs as e-commerce takes share.
How U.S. labor statistics are collected
Most U.S. labor statistics come from the Bureau of Labor Statistics on a fixed calendar. Employment Situation usually lands on the first Friday of the month at 8:30 a.m. Eastern, JOLTS runs a month behind it, state data comes mid-month and the employment cost index each quarter. Private sources fill gaps: ADP and Challenger publish in the same week ahead of BLS, and Indeed updates its job postings index daily.
Both BLS surveys count levels in the millions, so monthly moves are small against them. September's 29,000 gain was 0.02% of 159.0 million payroll jobs, a drop in the bucket, which is why analysts watch the three-month trend and the revisions.
Analysts who need this data faster, or for a single company, use labor market intelligence built on job postings and profiles. Vendors such as Revelio Labs and LinkedIn Talent Insights sell that view to companies for hiring and investment decisions. Our talent analytics pricing research and the LinkedIn Talent Insights review show what it costs, and the workforce intelligence software ranking compares the tools side by side.
Recruiters tracking pay can check compensation benchmarking tools, and recruitment market intelligence covers how hiring teams turn these releases into sourcing plans. Self-employed workers and owners of small businesses sit mostly outside the payroll count. The freelance statistics and small business statistics reports cover that side of the workforce.
The agencies and surveys behind each labor figure, and the months still to be revised
Bureau of Labor Statistics, bls.gov: Employment Situation for September 2026 (2 October 2026) with its technical note and table B-1, archived releases of 11 February and 6 March 2026, the release schedule, Job Openings and Labor Turnover Survey (29 September 2026).
Other BLS programs: state unemployment (18 September 2026), consumer price index and real earnings (August 2026 data), employment cost index (June 2026 data), Occupational Employment and Wage Statistics (May 2025 data) and Employment Projections 2025-2035.
Series and policy: fred.stlouisfed.org (BLS payroll, unemployment and JOLTS series through 2 October 2026), federalreserve.gov (Summary of Economic Projections and FOMC statement, 16 September 2026), atlantafed.org (Wage Growth Tracker, August 2026 data) and dol.gov (weekly unemployment insurance claims, week ending 26 September 2026).
Private trackers: challengergray.com (September 2026 job cuts report, 1 October 2026; December 2025 report), adpemploymentreport.com (National Employment Report, September 2026), hiringlab.indeed.com (US labor market snapshot, 24 August 2026), conference-board.org (Consumer Confidence, September 2026) and nfib.com (jobs report, September 2026).
Every figure was checked against its source on 7 October 2026. BLS revises each monthly payroll figure twice and benchmarks the series once a year, the household survey for October 2025 was never collected, and the October 2026 report is due on 6 November, so the 2026 months on this page will move.
Frequently asked questions
Is unemployment rising or falling right now?
Flat. The rate was 4.2% in September 2026, within the 4.1% to 4.3% band it has held since March, and below the 4.5% peak of November 2025. The Fed expects 4.1% by the end of 2026.
Is a 5% unemployment rate bad?
It would sit 0.8 point above both today's 4.2% and the 4.2% Fed officials project for the longer run. California, Connecticut and Oregon run at 5.1% today. A national 5% would mean roughly 1.4 million more unemployed people than in September 2026.
Why is it so hard to find a job right now in 2026?
Employers are hiring at a 3.3% monthly rate against 3.9% in 2019, so demand for workers turns into hires more slowly. 1.94 million people have been unemployed for 27 weeks or more, 27.1% of everyone looking.
How many people are employed in the U.S.?
About 163.2 million people had a job in September 2026 on the household survey, and employers reported 159.0 million payroll jobs. That's 59.2% of adults 16 and over.
What state is #1 in unemployment?
California, Connecticut and Oregon shared the highest state rate in August 2026 at 5.1%. The District of Columbia, counted separately, was at 5.7%.
Will the 2026 job market be better than 2025?
On payrolls, it already is: 612,000 jobs added in nine months against 116,000 in all of 2025. Unemployment is lower, 4.2% against 4.4% in December 2025, while hiring and quits remain below 2019 rates.
Bottom line
The U.S. labor market in late 2026 is slow, with low churn and stable unemployment, and the economy is still adding jobs. Payroll growth averages 45,000 a month, unemployment holds at 4.2%, and the hires and quits rates sit below 2019 levels while layoffs stay low.
For a job seeker that means longer searches, with 27.1% of the jobless out of work for over six months. For an employer it means a pool of candidates who rarely quit, and wages rising 3.0% a year against 3.4% inflation.
Keep an eye on the October report, due on 6 November. It will be the first to measure the economy after the September rate increase.