Machine learning statistics 2026: market size, adoption and the math behind ML models
 By Jan Suski. I go deep on every review, checking every number against its source and digging up details other coverage misses, a habit from six years of SEO and link building for tech companies. Bylines at Brand24 and Senuto. How the scoring works.
The numbers Machine learning market, adoption and jobs, checked 19 November 2026
The highest 2025 machine learning market size estimate is 2.1 times the lowest, so every figure needs its publisher attached.
Adoption is broad and shallow: 88% of organizations use AI somewhere, and McKinsey's 2026 survey finds about 6% attribute 5% or more of EBIT to it.
Gartner's 2026 AI spending forecast is about 20 times Grand View's 2026 machine learning market figure, with AI infrastructure alone at $1.48 trillion.
AI vendors, cloud partners and analysts quote ML market sizes in every pitch. Send the segment, the region or the industry and I'll source a version you own.
The global machine learning market was worth somewhere between $47.99 billion and $100.0 billion in 2025, depending on which research house you ask. Grand View Research puts it at $100.0 billion and forecasts $684.4 billion by 2033. Fortune Business Insights puts the same year at $47.99 billion. Meanwhile 88% of organizations told McKinsey they use AI in at least one business function.
This report collects the machine learning (ML) statistics that trace to a named publisher: market size and forecasts from four research houses, adoption from McKinsey, spending from Gartner, investment from Stanford's AI Index, and jobs from the US Bureau of Labor Statistics. The second half covers the other thing people mean by "machine learning statistics": the statistical methods ML models are built on.
It's written for analysts sizing the market, buyers comparing machine learning solutions, and students who want the core concepts with the numbers attached. Where the houses disagree, the gap gets its own section.
Global machine learning market size in 2026
Three of the large research houses published updated machine learning market reports in 2026. Each gives a 2025 base, a 2026 estimate and a long-range forecast:
- Grand View Research: $100.0 billion in 2025, $135.8 billion in 2026, $684.4 billion by 2033 at a 26.0% CAGR (published July 2026)
- Precedence Research: $93.95 billion in 2025, $126.91 billion in 2026, $1,709.98 billion by 2035 at a 33.66% CAGR (updated 17 September 2026)
- Fortune Business Insights: $47.99 billion in 2025, $65.28 billion in 2026, $432.63 billion by 2034 at a 26.7% CAGR (updated 28 September 2026)
All three are on the same page about direction: significant growth, led by North America, with Asia Pacific growing fastest. They disagree on size by a factor of two. The 2026 figures run from $65.28 billion at Fortune to $135.8 billion at Grand View.
Significant growth at these rates compounds fast. A 26.0% CAGR doubles a market roughly every three years, so Grand View's $135.8 billion for 2026 passes $270 billion around 2029 if the rate holds. Precedence's 33.66% rate doubles faster, about every two and a half years.
Averaging the three 2026 estimates gives about $109 billion, a number no house published, so treat it as a midpoint only. The market growth rates sit closer together than the sizes: 26.0%, 26.7% and 33.66%. Buyers of machine learning technologies watch the rate, since it signals how fast vendors will expand product lines. Analysts sizing one segment of machine learning technologies care more about the base year, because a wrong base carries through every forecast year.
Why machine learning market size estimates diverge
The houses measure the same industry with different scopes, base years and definitions. Here's what each one published:
| Publisher | 2025 estimate | 2026 estimate | Forecast | CAGR |
|---|---|---|---|---|
| Grand View Research | $100.0B | $135.8B | $684.4B by 2033 | 26.0% (2026-2033) |
| Precedence Research | $93.95B | $126.91B | $1,709.98B by 2035 | 33.66% (2026-2035) |
| Diligence Insights | $73.10B | n/a | $369.43B by 2031 | 31.0% |
| Fortune Business Insights | $47.99B | $65.28B | $432.63B by 2034 | 26.7% (2026-2034) |
Copy these lines into an email, fill them in and send. I reply with scope and a price within 2 to 3 business days.
Open the email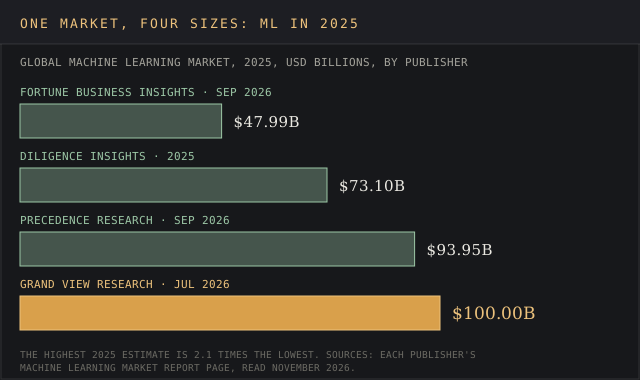
The devil's in the details. Three things drive the spread:
- Scope. Grand View counts services, which took the lion's share of its 2025 total at 55.2%, plus hardware and software. Precedence segments by type, deployment and end user and doesn't break out a component split. Fortune segments by enterprise type, deployment and end-use industry.
- Revisions inside one house. Fortune's March 2025 edition projected $309.68 billion by 2032 at a 30.5% CAGR, per its press release. The September 2026 edition moved the endpoint to $432.63 billion in 2034. Revisions like this are par for the course.
- Paywalled figures. Statista Market Insights tracks a machine learning market too, and its outlook page masks the dollar values without a subscription. The only rate shown is a CAGR above 18.7% for 2023 to 2030.
Diligence Insights' report, listed on MarketResearch.com, sits in the middle at $73.10 billion. If you're a senior research analyst quoting any of these, quote the house and the year with the number. A bare "the machine learning market is worth $100 billion" leaves out half the story.
Gartner's AI spending forecast belongs in a different bucket. It counts $2.67 trillion of AI spending in 2026, most of it infrastructure, and it is no machine learning market size estimate at all.
Machine learning market segmentation
The houses publish their segment splits at different levels of detail. Grand View gives the most percentages:
- Component: services at 55.2% of the 2025 market; hardware growing fastest at a 30.6% CAGR to 2033
- Enterprise size: large enterprises at 63.8% in 2025; small and medium enterprises growing fastest
- End use: advertising and media the largest at 17.3% in 2025; healthcare named the fastest-growing
Fortune Business Insights splits the market by deployment and enterprise type. Large enterprises take 55.61% and cloud deployment 53.14% of its 2026 estimate. Precedence names cloud the leading deployment mode in 2025, healthcare the leading end user and retail the fastest-growing one, and gives no percentages for any segment.
The end-use lists overlap: healthcare, banking and financial services, retail, automotive and transportation, advertising and media, manufacturing industries, law and agriculture all appear in at least one house's segmentation.
Regional breakdown of the machine learning market
North America leads in every report. Grand View gives it 30.3% of the 2025 market, Precedence 32% and Fortune 32.5%. Fortune adds dollar values for each region:
- North America: $15.6 billion in 2025, rising to $21.33 billion in 2026
- Europe: $13.48 billion in 2025 (28.10%), rising to $18.19 billion in 2026
- Asia Pacific: 29.70% of the 2025 market, projected at $19.6 billion in 2026
- United States: $16.7 billion in 2026
- Japan: $5.15 billion in 2026, a drop in the bucket next to the US
Grand View names the US the largest single country market, and both Grand View and Precedence give Asia Pacific the fastest market growth of any region. Stanford's AI Index points the same way on investment: US private AI investment reached $285.9 billion in 2025, more than 23 times China's $12.4 billion, per the 2026 AI Index Report.
Key companies in the machine learning market
The research houses list overlapping sets of key companies. Grand View names Amazon Web Services, Baidu, Google, H2O.ai, Hewlett Packard Enterprise, Intel, IBM, Microsoft, SAS Institute and SAP. Precedence adds Fair Isaac, BigML, NVIDIA, Databricks and DataRobot.
The list splits into three groups:
- Cloud platforms: AWS, Microsoft Azure and Google Cloud, where most ML models are trained and served. Google Cloud Platform's Vertex AI, AWS SageMaker and Azure Machine Learning bundle training, deployment and automated machine learning.
- Chips: NVIDIA and Intel supply the hardware that Grand View expects to grow fastest.
- Software and analytics: IBM, SAS, SAP, Databricks, DataRobot, H2O.ai, BigML and Fair Isaac sell machine learning capabilities on top of data platforms.
Stanford's AI Index adds the model builders: industry produced over 90% of notable AI models released in 2025. None of the three public report pages gives company-level machine learning revenue, so read between the lines of each vendor's cloud and AI segment reporting.
Machine learning adoption in business
McKinsey's Global Survey on the state of AI is the longest-running adoption series. Its 2025 edition, fielded with 1,993 participants from 25 June to 29 July 2025, found:
- 88% of respondents' organizations use AI in at least one business function, up from 78% a year earlier
- 62% are at least experimenting with AI agents
- 23% are scaling an agentic AI system somewhere in the enterprise
McKinsey's 2026 survey moves the story from use to value. 44% of respondents report AI scaling across their enterprise, 37% attribute at least some EBIT impact to AI, and high performers, who attribute 5% or more of EBIT to AI, stay flat at about 6%. 32% say their organizations decided against buying a software product because they could build it with agentic coding tools.
That gap between use and payoff is the elephant in the room for every forecast above. The 26% to 34% growth rates assume adoption turns into spending, and McKinsey's numbers say most companies are still working out the value.
Spending and investment in machine learning technologies
Gartner's September 2026 forecast puts worldwide AI spending at $1.79 trillion in 2025, $2.67 trillion in 2026 and $3.64 trillion in 2027. The 2026 total breaks down as:
- AI infrastructure: $1.48 trillion
- AI services: $576.5 billion
- AI software: $461.6 billion
- AI cybersecurity: $51.3 billion
Gartner raised the 2026 figure twice during the year: $2.53 trillion in January, $2.59 trillion in May and $2.67 trillion in September. Its analysts place generative AI in the Trough of Disillusionment through 2026 and expect enterprises to buy AI through incumbent software vendors.
Investment runs ahead of the curve. The 2026 AI Index puts US private AI investment at $285.9 billion in 2025. Global corporate AI investment reached $581.7 billion, up 130%, as reported by Unite.AI from the same report.
For the broader numbers on artificial intelligence use, our AI statistics report and the AI adoption statistics report cover consumer and enterprise data, and our SaaS statistics report tracks the software spending those AI features are sold into.
Machine learning in data science and data analytics jobs
Demand for machine learning skills shows up in labor statistics. The US Bureau of Labor Statistics projects data scientist employment to grow 34% from 2024 to 2034, against 3% for all occupations, per its Occupational Outlook Handbook:
The US Bureau of Labor Statistics projects data scientist jobs to grow 34% from 2024 to 2034, against 3% for all occupations.
Projected growth in US data scientist jobs, 2024 to 2034
Source: US Bureau of Labor Statisticse.g. hiring demand for the roles your product serves
Source: linked, checked, dated- 245,900 data scientist jobs in 2024
- 82,500 jobs added by 2034
- About 23,400 openings a year
- Median pay of $112,590 in May 2024
BLS ranks data scientists the fourth-fastest-growing occupation and ties the growth to demand for building AI models and data analysis. The World Economic Forum's Future of Jobs Report 2025 puts AI and machine learning specialists at the top of its fastest-growing jobs list for 2025 to 2030, based on a survey of employers covering more than 14 million workers.
Data science roles ask for statistical knowledge first. BLS lists developing statistical models among the core duties, which is why the second half of this report covers the statistics itself.
Core concepts: the statistics machine learning runs on
Machine learning relies on statistical methods at every step: describing data, fitting models, testing results and measuring error. A review in the PMC archive on common statistical concepts in supervised machine learning walks through regression, classification and their performance metrics. IBM's guide to statistical machine learning frames the field the same way.
The two disciplines share the same core of learning from data and differ in aim. Statistics prioritizes inference: understanding the process that generated the data and quantifying uncertainty. Machine learning prioritizes prediction: maximizing accuracy on data the model hasn't seen. Modern data science uses both, and probability theory and linear algebra sit under each.
Supervised, unsupervised and reinforcement learning
Machine learning algorithms fall into three main families:
- Supervised learning uses labeled training data to predict an outcome. Regression models predict a number; classification models predict a category.
- Unsupervised learning finds patterns in unlabeled data. K-means clustering, which groups data points around a set number of centers, is the textbook example.
- Reinforcement learning teaches an agent through trial and error, rewarding actions that move it toward a goal.
Semi-supervised and self-supervised learning sit between the first two. Large language models are pretrained with self-supervised learning on unstructured data, then tuned with reinforcement learning from human feedback. In a nutshell, most production systems mix more than one family.
Which machine learning algorithms teams use
Production machine learning algorithms cluster around a short list, matched to the shape of the data:
- Tabular business data: gradient-boosted decision trees and logistic regression, still the default machine learning algorithms for churn, credit and pricing models
- Text: transformer models for natural language processing, from classification to generation
- Images and video: convolutional and vision transformer neural networks for computer vision
- Grouping and segmentation: k-means and hierarchical clustering
- Recommendations: matrix factorization and two-tower neural networks
The choice of machine learning technologies follows the shape of the data. A gradient-boosted model on a clean customer table often beats a deep network, and it trains in minutes on a laptop. Picking among machine learning algorithms is where the statistics below earn their keep, because evaluation metrics decide which candidate wins on held-out data.
Descriptive statistics and data analysis
Every project starts with data analysis: summarizing what the data looks like before any model touches it. The statistical measures that matter most are the mean, the median, the variance and the standard deviation, which is the square root of the variance and comes back in the same units as the data.
Descriptive statistics catch problems early, and skipping them is a way to cut corners that shows up later. A feature with a standard deviation of zero carries no information, and a target with a long right tail will distort a model trained to minimize squared error. Exploratory analysis is also where sampling problems surface; our guide to sampling bias covers how a skewed sample breaks every number built on it.
Probability distributions: normal, Gaussian and the probability density function
A random variable is a quantity whose value depends on chance, and a probability distribution describes how likely each value is. A random process is a sequence of random variables indexed over time, such as daily sales or sensor readings.
For a continuous random variable, the probability density function gives the relative likelihood of each value, and the area under the probability density curve between two points is the probability of landing between them. The normal distribution, also called the Gaussian distribution, is the bell curve:
- The standard normal distribution has a mean of 0 and a standard deviation of 1
- About 68% of values fall within one standard deviation of the mean
- About 95% fall within two, and 99.7% within three
The Central Limit Theorem explains why the bell curve shows up everywhere: averages of many independent samples tend toward a normal distribution, whatever the shape of the data. That result lets a model's error on a test sample stand in for its error on the whole population.
Conditional probability and Bayes' theorem
Conditional probability is the probability of an event given that another has happened, written P(A|B). Bayes' theorem turns it around: P(A|B) = P(B|A) × P(A) / P(B). Naive Bayes classifiers apply it directly, and spam filters were one of the first machine learning applications to use it at scale.
The classic trap is a rare condition with an accurate test. If 1% of cases are positive and a test catches 99% of them with a 5% false-positive rate, a positive result is right only about 17% of the time. A rare positive case is a needle in a haystack, and the base rate decides how many false alarms bury it.
Maximum likelihood: the coin flip example
Most ML models learn unknown parameters by maximum likelihood estimation: pick the parameter values that make the observed data most probable. The coin flip example shows the idea in miniature.
Flip a coin 10 times and get 7 heads. The likelihood of that result for a coin with heads probability p is p7(1-p)3, and that mathematical function peaks at p = 0.7. So 0.7 is the maximum likelihood estimate. Logistic regression, neural networks and most classification models fit their weights the same way, by maximizing a likelihood or minimizing its negative log.
Linear regression and logistic regression
Simple linear regression fits a straight line between one input and one output: y = a + bx. It models a dependent variable as a linear function of an independent variable. With several dependent variables at once, the method becomes multivariate regression. Multiple linear regression extends that to many independent variables, and it's still the first model most analysts try on a numeric target.
Logistic regression handles categorical target variables. It passes a linear combination of inputs through a sigmoid curve to produce a probability between 0 and 1, then classifies by a threshold. It's fast, interpretable and a strong baseline for credit scoring, churn and fraud detection, even next to a complex model.
Hypothesis testing and statistical significance
Hypothesis testing asks if a result is likely to be due to chance. You state a null hypothesis, run one of the standard statistical tests (t-test, chi-squared, z-test), and get a p-value: the probability of seeing a result this extreme if the null were true.
By convention, a p-value under 0.05 is called statistically significant. Statistical significance says a difference is unlikely to be noise. The size of the difference needs its own number, and a tiny p-value on a huge test set can hide an effect too small to matter. In machine learning, statistical inference of this kind decides if model B's improvement over model A on a test set is real or a lucky split, which is the heart of A/B testing a model in production.
Confidence intervals
Confidence intervals put a range around an estimate. A 95% confidence interval for a model's accuracy means that if you repeated the sampling many times, about 95% of the intervals built this way would contain the true accuracy.
Reporting accuracy as 91% with a 95% confidence interval of 89% to 93% raises the bar on what a model report should say. Bootstrapping, which resamples the test set many times, is the common way to get confidence intervals for metrics that have no clean formula.
Evaluation metrics for ML models
Evaluation metrics measure a model's performance on data it didn't train on. For regression:
- Mean squared error (MSE): the average of squared differences between predicted and actual values
- Root mean squared error (RMSE): the square root of MSE, measured on the target's own scale
- R2: the proportion of variance in the target that the features explain
For classification models:
- Accuracy: the percentage of correct predictions
- Precision and recall: how many flagged cases are right, and how many real cases get flagged
- F1 score: the harmonic mean of precision and recall
- AUC: the area under the ROC curve, which measures how well the model separates the classes
Squared error punishes large misses hard, so one outlier can dominate MSE, a red flag worth checking before trusting the number. Cross-validation, which trains and tests on several splits of the data, checks that a model's performance holds on unseen data.
The bias-variance trade-off explains why that check matters: a complex model fits training data closely and generalizes worse. L1 and L2 regularization add a penalty on large weights to keep model complexity in check, and L1 also does feature selection by pushing weak features to zero.
Machine learning technologies: deep learning, NLP, computer vision and edge computing
The machine learning technologies driving the forecasts sit on top of the statistics above:
- Deep learning uses neural networks with many layers. It underpins the frontier models Stanford's AI Index tracks.
- Natural language processing covers text and speech recognition. Large language models are the deep learning branch of it.
- Computer vision handles images and video: medical imaging, quality control on production lines, self-driving perception.
- Edge computing runs ML models on devices close to the data, such as phones, cameras and factory sensors, which cuts latency and keeps data local.
- Automated machine learning (AutoML) automates model selection and tuning, which lowers the statistical knowledge a team needs to ship a first model.
Cloud computing carries most of the load, and cloud computing providers sell machine learning as a service on top of their compute. Training large neural networks on unstructured data takes clusters of accelerators, which is why AI infrastructure is the largest line in Gartner's spending forecast and why cloud computing deployment leads in Fortune's and Precedence's segmentation. Our data center statistics report covers the build-out behind it.
Each of these machine learning technologies leans on the same statistical base. Natural language processing turned into a deep learning problem once neural networks with attention could model whole sentences, and speech recognition followed the same path.
Computer vision models classify images with convolutional or transformer neural networks trained on millions of labeled examples. The machine learning algorithms differ in architecture, and all of them minimize a loss function estimated from training data.
Artificial intelligence is the umbrella term, and machine learning is the part of artificial intelligence that learns from data. Most of what the research houses size as the machine learning market is software, services and hardware sold to run these machine learning technologies in production.
Open models and developer use of machine learning tools
Two public sources show how widely machine learning solutions have spread among the people who build them. Hugging Face, the largest public hub for ML models, reported in its State of Open Source: Spring 2026 report that during 2025 it grew to:
- 13 million users
- More than 2 million public models
- More than 500,000 public datasets
Stack Overflow's 2025 Developer Survey found 84% of developers using or planning to use AI tools in their development process, up from 76% in 2024. Trust moved the other way: 46% said they don't trust the accuracy of AI output, up from 31%, and only 31% were using AI agents.
That pairing fits the McKinsey data. Use of machine learning tools is close to universal among developers and companies, and confidence in the output is where the work still sits. For anyone evaluating ML models, the statistical reasoning in the core concepts section is the check on that output.
How the machine learning market is tracked, and what the forecasts leave out
Research houses size the machine learning market with a mix of top-down and bottom-up methods. Top-down starts from total IT or AI spending and applies a machine learning share. Bottom-up adds up vendor revenue from machine learning solutions, segment by segment and region by region, then checks the total against interviews with buyers and suppliers. Our market sizing template sets out both methods in one sheet.
Both methods run into the same gaps:
- Vendors rarely report ML revenue. AWS, Microsoft and Google report cloud segments, so a house has to estimate the machine learning share inside them.
- In-house builds don't show up. A bank that trains its own fraud models on its own servers spends on staff and hardware, which a market report may or may not count as machine learning.
- Open models are free. The 2 million public models on Hugging Face carry no license fee, so their use adds compute spending and no software revenue.
- Definitions move. Generative AI now sits inside some houses' machine learning totals and outside others'.
For anyone building their own estimate, our guide to data triangulation covers how to cross-check a market figure against two independent sources before it goes in a deck. A forecast that can't be traced to its method is a long shot as a planning number.
Growth drivers and constraints
Every research house names the same drivers in different words:
- Demand to automate business processes, which Precedence lists as its main driver, and to cut the cost of business processes that still run on manual review
- Digital transformation initiatives and data driven decision making across industries
- Generative AI, edge AI and industry-specific applications, which Grand View names as the main opportunity
- Cloud computing deployment, which lowers the entry cost of machine learning solutions for smaller firms
Constraints are just as consistent across reports. Grand View lists data privacy concerns and a shortage of skilled professionals as restraints. Precedence names data authenticity: inaccurate or imbalanced data distorts results. McKinsey's 2026 survey adds cost, with AI-related operating costs constraining AI use for about one in five organizations.
That skills gap ties back to the BLS numbers. 23,400 data scientist openings a year in the US alone is a lot of hiring for a field where it takes years to know the ropes of statistical reasoning.
Machine learning applications by industry
Healthcare is the segment the houses keep an eye on most. Precedence names it the leading end user in 2025, and Grand View expects it to grow fastest. The applications range from early disease detection and diagnosis on medical imaging data to personalized treatment plans and operational efficiency in hospitals.
Other industries use machine learning in narrower, well-proven ways:
- Financial services: fraud detection, credit scoring and anti-money-laundering alerts
- Advertising and media: ad targeting and recommendation, the largest end-use segment in Grand View's data at 17.3%
- Manufacturing industries: computer vision for quality control and predictive maintenance
- Retail: demand forecasting, pricing and supply chain management, the fastest-growing end user in Precedence's report
For teams sizing one of these markets themselves, our guide on how to size a market covers the top-down and bottom-up methods the research houses use.
Delivered for your site and your byline. Hosting here is optional.
Frequently asked questions
What are machine learning stats?
The term covers two things: statistics about the machine learning market, such as Grand View's $100.0 billion 2025 market size, and the statistical methods ML models use, such as regression, hypothesis testing and probability distributions.
How big is the machine learning market?
Between $47.99 billion and $100.0 billion in 2025, depending on the publisher. Grand View Research gives $100.0 billion, Precedence Research $93.95 billion, Diligence Insights $73.10 billion and Fortune Business Insights $47.99 billion. For 2026, the published range runs from $65.28 billion to $135.8 billion.
Which region leads the machine learning market?
North America, with 30.3% to 32.5% of the 2025 market across the three houses that publish a share. Asia Pacific is the fastest-growing region in Grand View's and Precedence's reports, and Fortune puts it at 29.70% of the 2025 total.
Is machine learning still in demand in 2026?
Yes. BLS projects 34% growth in US data scientist jobs from 2024 to 2034, and the World Economic Forum ranks AI and machine learning specialists among the fastest-growing roles to 2030.
Is AI growing or dying?
Artificial intelligence is growing on every published measure. Gartner forecasts AI spending up 49.5% in 2026 to $2.67 trillion, and McKinsey found 88% of organizations using AI in 2025, up from 78%.
Is ChatGPT AI or ML?
Both. ChatGPT is an artificial intelligence product built with machine learning: a large language model trained on text with deep learning.
Is ChatGPT ML or DL?
Deep learning, which is a subset of machine learning. The model behind ChatGPT is a transformer neural network with billions of parameters.
Is ML math heavy?
Building models from scratch takes linear algebra, calculus and probability theory. Applying existing libraries takes less, but you still need enough statistics to read evaluation metrics and confidence intervals correctly.
What is statistics for machine learning?
The subset of statistics ML practitioners use most: descriptive statistics, probability distributions, maximum likelihood, regression, hypothesis testing, confidence intervals and evaluation metrics.
Can ChatGPT do statistical analysis?
It can run statistical tests and regressions on uploaded data by writing and executing code. Check the method and the assumptions it chose, since the output is only as good as the test picked.
What are the 7 types of machine learning?
Lists vary. A common one is supervised, unsupervised, semi-supervised, self-supervised, reinforcement, online and transfer learning. The first three families above cover most production systems.
What are the 5 basic concepts of statistics?
Most courses start with populations and samples, descriptive statistics, probability distributions, hypothesis testing and regression.
Bottom line
The machine learning market was worth $47.99 billion to $100.0 billion in 2025, depending on the house, and every forecast points to growth of 26% to 34% a year. Grand View's $684.4 billion by 2033 is the most quoted endpoint. Quote it with the publisher and the year, because Fortune's figure for the same market is half its size.
Adoption is wide, with 88% of organizations using AI, and value is concentrated in about 6% of high performers. Behind both sits the same statistical toolkit: regression, probability distributions, hypothesis testing and evaluation metrics decide which ML models earn their place in production.
AI vendors, consultancies and investors use reports like this one in investor decks and sales briefs.
A report on your topic for a blog page, gated content or a lead magnet.
Written for your client and published under their brand, with my name left off.
Your report on marketintelligencetools.com, with 2 to 3 CTAs carrying your sponsored links.
Default terms: the report is yours to publish, and I keep the right to republish it on this site behind a gate, outside Google's index.
Which house published each machine learning figure, and what none of them disclose
Market size and forecasts: grandviewresearch.com (machine learning market report, published July 2026), precedenceresearch.com (report 3156, updated 17 September 2026), fortunebusinessinsights.com (report FBI102226, updated 28 September 2026, and the March 2025 press release), marketresearch.com (Diligence Insights listing) and statista.com (Market Insights outlook, dollar values paywalled).
Adoption: mckinsey.com (State of AI 2025, fielded 25 June to 29 July 2025, and State of AI 2026).
Spending: gartner.com (AI spending forecasts of January, May and September 2026). Investment: hai.stanford.edu (2026 AI Index Report, 13 April 2026) and unite.ai. Jobs: bls.gov (Occupational Outlook Handbook, data scientists) and weforum.org (Future of Jobs Report 2025).
Developers and open models: stackoverflow.co (2025 Developer Survey) and huggingface.co (State of Open Source, Spring 2026). Statistical concepts: pmc.ncbi.nlm.nih.gov (PMC9949554) and ibm.com. Every figure was checked on 19 November 2026.
None of the research houses publishes company-level machine learning revenue, and the large cloud vendors report cloud segments with no machine learning line. Market shares by company on this topic are estimates by whoever publishes them.