Video marketing statistics 2026: adoption, ROI, budgets and digital video ad spend
 By Jan Suski. I go deep on every review, checking every number against its source and digging up details other coverage misses, a habit from six years of SEO and link building for tech companies. Bylines at Brand24 and Senuto. How the scoring works.
91% of businesses use video as a marketing tool, and 82% of video marketers say it gives them a good return, down from 93% a year earlier, according to Wyzowl's State of Video Marketing 2026. In the US, the Interactive Advertising Bureau forecasts $81.9 billion of digital video ad spend for 2026, 61% of everything spent on TV and video advertising.
This report collects the latest video marketing statistics for 2026 from the publishers that measure them. Wyzowl and Wistia cover what video marketers do and say, the IAB covers video advertising budgets, YouTube and vidIQ cover views, and Cisco and Ericsson cover video's share of traffic.
Wyzowl's annual video marketing report and Wistia's State of Video report are the two marketer surveys used throughout. Each figure links to its source, and where two sources disagree, the gap gets its own section.
It's written for marketing teams setting a video plan, analysts checking video marketing statistics before they go in a deck, and anyone who's seen video quoted as 82% of internet traffic with no date attached. That figure is a forecast Cisco made in November 2018 for the year 2022.
The numbers Video marketing, ad spend and views, checked 17 November 2026
Reported ROI fell 11 points in a year while 91% of businesses kept using video.
Social video passed connected TV in US ad spend during 2025, at $28.2 billion against $26.5 billion.
LinkedIn's share of teams using it for video rose 33 points in two years, per Wistia.
Video agencies, platforms and SaaS teams quote adoption and ad spend numbers in every deck. Send the platform or the market and I'll source a version you own.
How many businesses use video marketing
Video marketing adoption stands at 91% of businesses in Wyzowl's State of Video Marketing 2026, which surveyed 266 respondents in late 2025. 93% of those video marketers say video is an important part of their marketing strategy, and 67% of the businesses that don't use video yet say they plan to start.
A 266-person sample can't carry decimal-point precision. Read the headline as about nine in ten businesses using video, and keep an eye on the sample size when you compare it with larger surveys.
Most video creation happens in-house, at more than half of companies. 59% of businesses that use video marketing make their marketing videos in-house, 10% only outsource, and 32% mix the two. Live action is the most common style at 51% of respondents, ahead of animated video at 23% and screen-recorded video at 19%.
Why some businesses still don't use video
Among businesses that don't use video marketing, 24% say they don't feel it's needed and another 24% say it's too expensive. 19% cite a lack of time, 10% are unclear on the return, and 10% don't know where to start.
Cost shows up on the user side of the survey too. 38% of video marketers say video creation is getting more expensive, 32% see no change and 30% say it's getting cheaper, so more than half see no rise. With the rising-cost group ahead of the falling-cost group by eight points, price stays on the list of reasons to wait.
What marketers say video delivers
Video marketers say video works on nearly every goal Wyzowl asks about. 93% of marketers say video has helped increase brand awareness, down from 96%, and 93% say video has helped people understand their product or service. 85% of marketers say video has helped them generate leads.
Further down the funnel, 83% of marketers say video has helped increase sales directly. 82% say video has increased web traffic to their site, and 82% say it has increased dwell time, the time a visitor spends on a page. The lowest score in the set, 57%, goes to video reducing support queries.
Those answers come from people who already chose video, so treat them as a measure of satisfaction among users. A brand video that lifts awareness for one company can miss the mark for another, and neither survey splits results by industry.
Video marketing ROI
The headline video marketing ROI figure fell. 82% of marketers say video gives them a good return on investment in the State of Video Marketing 2026, against 93% in the prior edition, an 11-point fall in a single year. It hasn't sent teams back to the drawing board, since 92% still plan to spend the same or more.
The ROI answers rest on mixed measures. When Wyzowl asks how teams judge video marketing success, 67% track views, 63% engagement, 52% leads or clicks, 40% retention, 36% brand awareness and 32% sales. 17% of respondents don't track video spend at all, which leaves that group with no cost side for a return calculation.
For a marketing team building a business case, the sales line is the one to zero in on. Views and engagement are easy to report, and talk is cheap until a video can be tied to revenue, which only 32% of respondents measure.
Video promotion budgets and the marketing budget for video
92% of video marketers plan to spend the same or more on video in 2026, per Wyzowl. 46% put a third of their marketing budget or less into video, and 41% spent money on video ads in the past year, up from 36%.
Wistia's State of Video 2026, released on 1 May 2026 and based on nearly 1,000 marketing professionals, shows slower budget growth. 49% of marketers plan to increase video spend in 2026, down from 57% a year earlier, and 51% expect their video budgets to stay flat or decline, according to PPC Land's summary of the report.
Video promotion budgets are rising faster than video budgets as a whole. 48% of teams are raising distribution and promotion spend, against 7% cutting it. That's close to seven teams paying more to get each video seen for every one paying less.
The two surveys disagree on how many marketers plan bigger budgets, 92% saying same or more in one and 49% saying more in the other, because they ask different questions. Wyzowl folds teams holding spend level into its figure. Wistia counts only increases.
Digital video ad spend in the US
US digital video ad spend will reach $81.9 billion in 2026, an 11% rise, according to the IAB's 2026 Digital Video Ad Spend & Strategy report, as reported by eMarketer. Digital video takes 61% of total TV and video ad spend in that forecast, leaving linear TV with 39%.
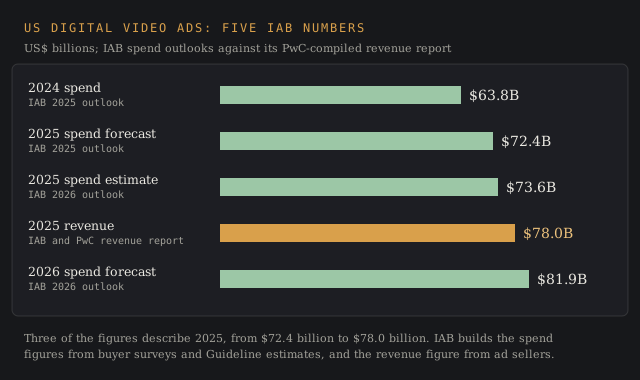
The 2025 base is $73.6 billion in the IAB's 2026 full report, which uses Guideline estimates of spend. A year earlier, the IAB's 2025 report had forecast $72.4 billion for 2025, a 14% rise from $63.8 billion in 2024, per Marketing Dive.
Copy these lines into an email, fill them in and send. I reply with scope and a price within 2 to 3 business days.
Open the emailThe longer run shows how far the money has moved. Spend on digital video stood at $26.2 billion in 2020, 29% of TV and video ad spend, per IAB figures reported by Influencer Marketing Hub. It reached $39 billion in 2021, crossed linear TV in 2024 and took 58% of the market in the 2025 forecast. Over half of US TV and video ad spend has gone to digital formats every year since.
Consumer packaged goods brands are the biggest category of digital video buyers. The IAB expects CPG brands to spend $16.9 billion on digital video in 2026, up from a $14.3 billion forecast for 2025. Retailers were forecast at $8.4 billion for 2025, an 18% rise. More than two-thirds of the advertisers in the 2026 survey say they're integrating agentic AI or preparing to.
Video advertising by channel for social, CTV and online video
| Channel | 2024 spend | 2025 forecast (IAB 2025 report) | 2026 forecast (IAB 2026 report) |
|---|---|---|---|
| Social video | $23.7B | $27.2B | $31.9B (+13%) |
| Connected TV | $23.6B | $26.6B | $29.3B (+11%) |
| Online video | $16.6B | $18.6B | $20.7B (+10%) |
| Total | $63.8B | $72.4B | $81.9B (+11%) |
The IAB's 2026 report says social video ad spend overtook CTV in 2025, putting social at $28.2 billion against $26.5 billion for CTV. Its 2025 report had the two channels within $0.1 billion of each other for 2024, at $23.7 billion and $23.6 billion, so the overtake depends on which edition's 2024 numbers you read.
Online video, the IAB's category for video ads bought outside social platforms and CTV, is the smallest of the three and the slowest growing in the 2026 forecast, at 10%. The CTV side of the market is covered in more depth in our streaming statistics, and total ad spend across channels in the advertising industry statistics.
Why video marketing statistics disagree
Recent video marketing statistics conflict for three reasons, and the conflicts show up in video content, ad spend and platform data alike. They measure different things, they come from different samples, and some of the most quoted ones are forecasts whose target year has passed. Four cases cover most of the conflicting numbers in circulation.
Three IAB figures for US digital video in 2025
The IAB has put three numbers on 2025. Its 2025 report forecast $72.4 billion of spend. Its 2026 report estimated $73.6 billion, a $1.2 billion upward revision that's par for the course in forecast data. Its Internet Advertising Revenue Report, compiled by PwC, counted $78 billion of US digital video advertising revenue in 2025, a 25.4% rise, per PPC Land.
The spend figures describe what buyers put into digital video, built from buyer surveys and Guideline data. The revenue figure adds up what ad sellers report. Use the spend figure for a share-of-budget argument and the revenue figure for a market-size argument, and name the one you used. The top and bottom 2025 figures sit $5.6 billion apart.
AI adoption in video, by survey
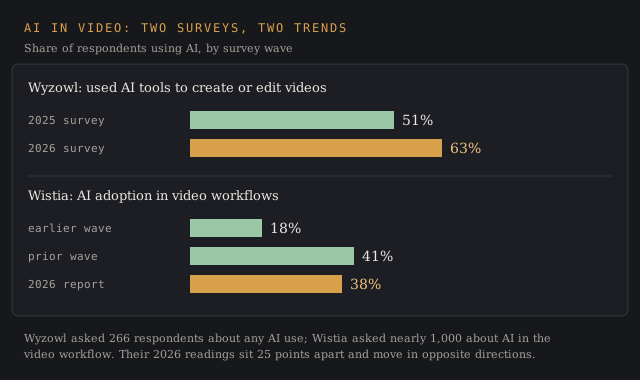
Wyzowl and Wistia both asked about AI in video marketing and got answers 25 points apart. 63% of Wyzowl's respondents have used AI tools to create or edit videos, up from 51%. Wistia puts AI adoption in video workflows at 38%, down from 41% in its prior wave and up from 18% in the wave before that.
Want a survey comparison chart like this for your category? Send the two surveys or the topic.
Email a briefWyzowl counts anyone who has used an AI tool on a video. Wistia asks about AI built into how the team produces video. A team that tried an AI script writer once lands in Wyzowl's 63% and can still sit outside Wistia's 38%.
Video's share of internet traffic
The most quoted traffic figure, video at 82% of all IP traffic, comes from Cisco's Visual Networking Index released on 27 November 2018. It was a forecast for 2022, up from 75% in 2017, and the same forecast expected global internet users to reach 60% of the world's population by 2022.
Ericsson's mobile figures are newer. Its June 2026 Mobility Report puts video at about 75% of mobile data traffic at the end of 2025, when mobile networks carried 146 exabytes a month, and forecasts 328 exabytes a month by 2031. Its November 2025 edition, measuring four sampled networks, found video at about 50% of mobile traffic.
That's three numbers for one question, from 50% to 82%, and a red flag for any deck that cites one without a year. The Cisco figure describes a forecast for all IP traffic, the 75% a global mobile estimate, and the 50% a reading from four operators.
YouTube Shorts view counts
YouTube Shorts averaged more than 200 billion daily views by June 2025, CEO Neal Mohan said at Cannes Lions, against 70 billion announced in early 2024. The two figures don't count the same way. From 31 March 2025, YouTube counts a Shorts view on every play or replay with no minimum watch time, as Elite Content Marketer notes from YouTube's help pages, so part of the jump is a change in the counting rule.
The earlier milestones used the older rule. YouTube reported 6.5 billion daily Shorts views in March 2021, more than 30 billion in 2022 and 50 billion by December 2022, per Teleprompter's timeline of YouTube announcements, and more than 2 billion signed-in users watched Shorts each month by September 2023. Growth figures that straddle March 2025 compare two different definitions of a view.
Explainer videos, testimonial videos and product videos marketers make
Social media videos are the most common type, made by 69% of video marketers, with explainer videos close behind at 68%. Wyzowl's list then runs through testimonial videos at 57%, presentation videos at 48%, video ads at 48%, teaser videos at 45% and product demos at 39%.
Sales videos (37%), customer service videos (24%), training videos (23%) and customer onboarding videos (23%) sit in the middle. App demos (17%) and employee onboarding videos (16%) are the least common video formats in the survey.
Explainer videos earn their place on the viewer side too, and they're the second most common of the marketing videos in Wyzowl's list. 96% of consumers say they've watched an explainer video to learn more about a product or service, per Wyzowl.
Wistia's report names educational videos, product videos, social videos and webinars as the formats getting the most consistent investment, and it lists customer testimonial videos among the formats gaining ground. The educational category takes in tutorials and how to videos. Podcast video production rose 29% since Wistia's previous report, a shift tracked in our podcast industry statistics.
Product videos and customer testimonial videos do different jobs in the same funnel. Product demos appear in 39% of video marketing plans, testimonial videos in 57% and explainer videos in 68%, so more teams put a customer on camera than walk through the product themselves.
Short form video, long form video and video length
Short form video wins on preference among the video formats Wyzowl tests. When Wyzowl asks people how they'd most like to learn about a product or service, 63% pick a short video, against 12% for text, 7% for infographics, 5% for a sales call, 4% for an ebook and 4% for a webinar.
On video length, 71% of video marketers say videos between 30 seconds and 2 minutes are the most effective. YouTube has stretched the short form video category itself. Since October 2024, YouTube Shorts can run up to three minutes, so a short video on YouTube can now run past the 2-minute ceiling most video marketers favor.
Long form video content draws more plays on Wistia-hosted pages. Videos over 60 minutes had a 52% play rate and videos over 30 minutes 37%, against 24% for videos under a minute. Play rate counts the visitors who press play, so it says nothing about how long they watch.
The short form video numbers and the long form video numbers measure different moments. Preference data asks what people want before they've seen anything. Play rates record what a visitor on a page chose to open. Teams that put all their eggs in one basket on length are reading one of the two and ignoring the other.
Video marketing strategy and publishing frequency
Monthly is the most common publishing cadence in Wistia's 2026 survey, and the share of teams publishing daily or weekly is falling. Wistia didn't publish a percentage for each cadence, so the safest reading is that the typical team ships at least one video a month.
A video marketing strategy built on fewer, longer recordings fits that cadence. Teams record a webinar or a podcast episode, then cut it into social media videos and short video ads for each channel. The videos companies make are getting more reuse and more paid support, and the 48% of teams raising promotion budgets shows where part of the extra marketing budget goes.
Video ads are part of that shift on both sides of the survey data. 48% of video marketers make video ads in Wyzowl's State of Video Marketing 2026, 41% paid for video ads in the past year, and LinkedIn carries paid video ads for 62% of Wistia's respondents. Over half of the businesses that use video marketing in Wyzowl's sample, 59%, still spent nothing on video ads.
Video marketing platforms and where teams share videos
LinkedIn has displaced YouTube as the most used channel for B2B video in Wistia's 2026 report. Where teams share videos, 81% use LinkedIn against 76% for YouTube, and LinkedIn's share rose 33 percentage points in two years, so teams that moved video there in 2024 were ahead of the curve. It's also the top channel for repurposed clips at 67% and for paid video ads at 62%. B2B buying data sits in our B2B marketing statistics.
Wyzowl's broader video marketing sample still puts YouTube first. Among the video marketing platforms Wyzowl tracks, 82% of video marketers use YouTube, 70% LinkedIn, 69% Instagram, 66% Facebook, 56% webinars, 40% TikTok, 31% interactive video and 29% X. VR (19%), 360-degree video (18%) and Snapchat (16%) trail the list.
Use and results don't line up one to one. YouTube is rated effective by 69% of Wyzowl's respondents, Instagram by 56%, Facebook by 55%, LinkedIn by 50%, webinars by 42% and TikTok by 29%. LinkedIn has the widest gap of any platform, used by 70% and rated effective by 50%, the platform Wistia's B2B sample now ranks first for video.
Video marketing on social media differs by network, and platform-level figures live in our YouTube statistics, TikTok statistics and Instagram statistics, with cross-network social media numbers in the social media statistics.
AI video tools in the video workflow
AI tools have moved into video content creation within two survey cycles. 63% of video marketers have used AI tools to create or edit videos in Wyzowl's State of Video Marketing 2026, up from 51%. On YouTube, more than 1 million channels used the platform's AI creation tools daily in December 2025, Neal Mohan wrote in his 2026 letter.
63% of video marketers have used AI tools to create or edit videos, up from 51% a year earlier, per Wyzowl's State of Video Marketing 2026.
Video marketers who have used AI tools on video
Source: Wyzowle.g. AI adoption among video teams in your vertical
Source: linked, checked, datedThe same letter says more than 6 million daily viewers watched at least 10 minutes of AI-autodubbed content in December, and more than 20 million users asked YouTube's Ask tool about the videos they watched. Viewers are using AI video tools from the other side of the screen too.
Wistia's numbers temper the picture. AI adoption in video production was 38% in its 2026 report, a little below the 41% of the wave before. ChatGPT is the most used AI tool among Wistia's respondents at 64%. Teams using AI are 82% more likely to offer multilingual subtitles and 50% more likely to use audio descriptions.
Buying video tools has run ahead of fitting them together. 90% of teams grew their martech stack in the past 12 months, Wistia found, and 17% say the stack meets their requirements. Neither survey measures how many hours AI saves on video editing, so for teams that edit marketing videos across three or four tools, the jury's still out.
Adoption data for AI beyond video is in our AI adoption statistics. For a team planning to edit marketing videos with AI video tools in 2026, the useful number from Wistia is the 17%, since it shows how few teams think their current tools work together.
What consumers say about video content and video quality
Consumers ask for more video content. 84% of people say they'd like to see more video from brands in 2026, per Wyzowl, and 85% say a video has convinced them to buy a product or service. 80% say watching a video convinced them to buy or download an app.
In video marketing, video quality affects trust. 89% of consumers say video quality affects how much they trust a brand, down from 91% a year earlier. For that 89%, a team that cuts corners on a brand video pays for it in credibility.
Demand for video content and the cost of making it well pull in opposite directions for smaller teams. It's easier said than done to create video content at a quality 89% of viewers notice, on the budget 46% of businesses cap at a third of their marketing spend. Content strategy beyond video is covered in our content marketing statistics.
How many views video content gets on YouTube
Most YouTube videos get few views. vidIQ Research analyzed 38.2 million long-form videos and published the results on 16 September 2026. The median video drew 234 views in its first week, 70.1% got under 1,000 first-week views and 37.7% got under 100.
The top of the distribution takes the lion's share. 8.5% of videos reached at least 10,000 first-week views, and the top 1% of videos collected 54% of all first-week views in the sample.
Pew Research Center's 2019 study of popular channels found the same skew. The average video from those channels drew 58,358 views in its first week, while the median drew fewer than 3,860. A breakout hit is a needle in a haystack, and averages hide how rare it is.
For video marketers, the vidIQ median is a better planning baseline than any average in these video marketing statistics. A video content plan that assumes thousands of views per upload is assuming results that fewer than three in ten uploads reach in their first week.
Interactive video, webinars and live streaming video
Interactive video is used by 31% of video marketers in Wyzowl's survey, and webinars by 56%. Wistia's webinar data shows how long recordings keep working. About 40% of registrants attend, more than half of attendees keep the webinar tab active throughout, and replays keep collecting plays for up to 12 months.
About a third of webinars still draw views three months after broadcast, and nearly 9 in 10 companies repurpose their webinar recordings. Live streaming video and webinars produce the raw material that teams cut into clips, and 76% of teams resize videos to distribute video content across platforms, per Wistia.
Placement changes play rates. An embedded video on a homepage drew a 24% play rate on Wistia's platform, against 15% on product pages and 5% in blog posts. The same video can get almost five times the plays depending on which page it sits on.
Video marketing trends for 2026
Five shifts show up across the 2026 surveys and ad spend reports. Each one rests on a published figure from a marketing report or ad spend study in this piece.
- Social video passed CTV in US ad spend in 2025, and the IAB expects $31.9 billion of social video spend in 2026.
- LinkedIn leads YouTube as the B2B video marketing channel in Wistia's data, 81% to 76%.
- AI use in video rose to 63% in Wyzowl's survey and slipped to 38% in Wistia's.
- 48% of teams are raising video promotion spend while 51% hold video budgets flat or cut them.
- Social engagement became the top success metric for 22% of Wistia's respondents, up from 12% in 2024.
Teams that jump on the bandwagon of a single platform should check both surveys first. LinkedIn tops Wistia's B2B sample and has the widest gap between use and rated effectiveness in Wyzowl's broader one.
Delivered for your site and your byline. Hosting here is optional.
Frequently asked questions
What is the 3-3-3 rule for marketing?
The 3-3-3 rule is a planning shorthand with no single published origin. The common version, as LYFE Marketing describes it, tells a team to focus on three core messages, three audience segments and three marketing channels. Other versions swap in three content types or a three-second attention window, and Prime Firms notes the rule doesn't come from official marketing literature.
Is digital marketing still worth it in 2026?
Advertisers are still adding money. The IAB forecasts $81.9 billion of US digital video ad spend in 2026, 11% more than 2025, and 92% of video marketers in Wyzowl's survey will spend the same or more on video. The return looks less certain than a year ago, with 82% of marketers saying video gives a good ROI, down from 93%.
What are the current trends in video marketing?
Social video overtaking CTV in US ad spend, LinkedIn passing YouTube for B2B video, AI tools in 63% of video marketers' work, rising promotion budgets, and consumers asking for more video, with 84% saying so. YouTube Shorts averaged more than 200 billion daily views by June 2025, though YouTube changed how it counts a Shorts view that March.
What percentage of YouTube videos get over 1000 views?
About 30% in their first week. vidIQ's study of 38.2 million long-form videos found 70.1% got under 1,000 first-week views, so 29.9% reached 1,000 or more. The figure counts first-week views only.
How many businesses use video marketing?
91% of businesses use video as a marketing tool in Wyzowl's State of Video Marketing 2026, and 67% of those that have kept video on the back burner say they plan to start. The survey had 266 respondents.
How much is spent on video advertising in the US?
The IAB forecasts $81.9 billion of US spend on digital video ads in 2026, with social video at $31.9 billion, CTV at $29.3 billion and online video at $20.7 billion. The IAB and PwC revenue report counted $78 billion of digital video ad revenue in 2025.
Bottom line
In a nutshell, video marketing in 2026 is close to universal and still growing in spend, with 91% of businesses using video and US digital video ad spend forecast at $81.9 billion. The confidence behind it has slipped, with reported ROI down 11 points to 82% and the share of Wistia's respondents raising video budgets down from 57% to 49%.
Most teams who measure their marketing videos still say they work, with 85% crediting video with helping generate leads and 82% with lifting web traffic.
Check the date and the denominator before quoting any of these video marketing statistics. The 82% traffic figure is a 2018 forecast, the IAB has three totals for 2025, and the two biggest marketer surveys sit 25 points apart on AI use.
Video agencies, hosting platforms and brand teams use reports like this one in pitch decks and client briefs.
A report on your topic for a blog page, gated content or a lead magnet.
Written for your client and published under their brand, with my name left off.
Your report on marketintelligencetools.com, with 2 to 3 CTAs carrying your sponsored links.
Default terms: the report is yours to publish, and I keep the right to republish it on this site behind a gate, outside Google's index.
The surveys, ad spend reports and view counts behind this page
Marketer surveys: wyzowl.com (State of Video Marketing 2026, 266 respondents, late 2025) and ppc.land (summary of Wistia State of Video 2026, released 1 May 2026).
Ad spend: emarketer.com and s3.amazonaws.com/media.mediapost.com (IAB 2026 Digital Video Ad Spend and Strategy report, July 2026), marketingdive.com (IAB 2025 report), influencermarketinghub.com and ppc.land (IAB and PwC revenue figure for 2025).
Traffic, platforms and views: newsroom.cisco.com (Visual Networking Index, 27 November 2018), ericsson.com (Mobility Report, November 2025 and June 2026), blog.youtube (Cannes Lions, June 2025), elitecontentmarketer.com, teleprompter.com, thewrap.com (Neal Mohan 2026 letter), vidiq.com (16 September 2026), pewresearch.org (25 July 2019), lyfemarketing.com and primefirms.co.
Every figure was checked against its source on 17 November 2026. Wistia publishes no percentage for each publishing cadence, and neither marketer survey measures how many hours AI saves on video editing.