Fast fashion statistics 2026: market size, waste, emissions and labor
 By Jan Suski. I go deep on every review, checking every number against its source and digging up details other coverage misses, a habit from six years of SEO and link building for tech companies. Bylines at Surfer, Brand24, and Senuto. How the scoring works.
The numbers fast fashion, apparel and textiles, checked 4 October 2026
The $78.3 billion gap between the highest and lowest market estimate equals 48% of the lowest estimate, so the house you quote changes the story.
Polyester output reached 82.5 million tonnes in 2025, while less than 1% of clothing material gets recycled into new clothing.
Of the 110 brands Fashion Checker assessed, 32% have made a public pay commitment and 4% show tangible progress.
Four research houses put the world's 2025 fast fashion market somewhere between $161.7 billion and $240.0 billion, a $78.3 billion spread for the same year. Grand View Research publishes the top figure. The Business Research Company publishes the bottom one.
Underneath those totals sits a supply chain that spun 139 million tonnes of fiber in 2025, 59% of it polyester, according to the Textile Exchange Materials Market Report 2026 published on 22 September 2026.
This report gathers the fast fashion statistics and wider fashion industry statistics published through September 2026: market size by house, company results, fiber output, the environmental impact of fast fashion, textile waste & recycling, garment workers' pay and what fashion consumers buy. Each figure links to the body that produced it, with the report title & date.
It's written for analysts, sustainability teams and journalists who need a number they can cite. Where two publishers disagree on a figure, the gap between them gets its own section below.
Fashion industry statistics: $1.8 trillion in sales and 1% to 3% growth for 2026
Euromonitor valued the global fashion industry's apparel and footwear sales at $1.8 trillion in 2025 and expects the wider apparel sector to grow below 1% a year through 2030. Sportswear, at 2% a year through 2030, grows faster than the rest of the category. Fast fashion's $161.7 billion to $240.0 billion sits inside that total.
Statista Market Insights counts apparel alone at $1.92 trillion in 2026, $373 billion of it in the US, growing 2.62% a year to 2031. Spread across the world's population, that's $243.15 of apparel revenue and 24.1 pieces per person.
The State of Fashion 2026 from McKinsey and The Business of Fashion forecasts global fashion revenue growth of 1% to 3% for 2026. In its executive survey, 46% expect conditions to worsen, up from 39% a year earlier, and 25% expect them to improve.
Tariffs explain part of the gloom. The same report puts the weighted average US tariff on apparel and footwear at 13% before spring 2025, 54% at the spike and 36% by mid-October, adding about $27 billion in duties on imports.
Consumers pay part of that bill. The BLS apparel index rose 3.6% in the 12 months to August 2026, against 3.4% for all items. Our retail industry statistics report tracks the same price data across every store category.
Fast fashion refers to retailers that turn new styles from runways and social feeds into low-priced garments within weeks. Inditex's Zara, H&M and Shein run that model at global scale, and the retail market intelligence guide covers how analysts track them.
Fast fashion market size by research house
Five houses publish a figure for the fast fashion industry, and the four with a 2025 value span $78.3 billion. The table lists each one's base value, forecast endpoint and growth rate as published.
| Research house | Published | Base value | Forecast | CAGR |
|---|---|---|---|---|
| Grand View Research | August 2026 | $240.0B (2025) | $725.7B (2035) | 11.7% |
| Research Nester | 31 October 2025 | $163.8B (2025) | $436.5B (2035) | 10.3% |
| Fortune Business Insights | 14 September 2026 | $162.76B (2025) | $388.56B (2034) | 9.98% |
| The Business Research Company | September 2026 | $161.7B (2025) | $222.71B (2030) | 6.6% |
| Allied Market Research | August 2023 | $103.2B (2022) | $291.1B (2032) | 10.7% |
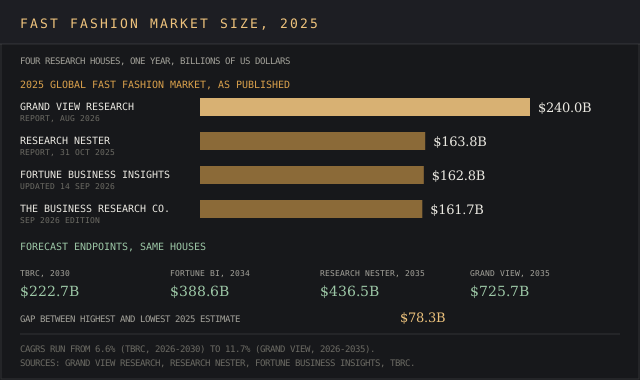
Regional splits differ too. Fortune Business Insights gives Asia Pacific the lion's share in 2025 at 34.73%, or $56.52 billion, with Europe at 24.19% and North America at 21.32%. Grand View Research names Europe the largest region in 2025, and Research Nester expects Asia Pacific to hold 45.6% by 2035.
The Allied figure is three years old and still travels. Blog roundups quoting its $291.1 billion for 2032 at 10.7% a year are a dime a dozen, because press releases repeated it for months after August 2023.
Why the published estimates diverge
Disagreement between houses is normal in category sizing. Four mechanics produce most of the spread here:
- Base year vintage. Allied's base is 2022, the other four use 2025, and older numbers keep circulating with no date attached.
- Forecast horizon. TBRC stops at 2030, Fortune Business Insights at 2034 and Grand View & Research Nester at 2035, so endpoint values can't be compared directly.
- Growth assumption. Annual rates run from 6.6% at TBRC to 11.7% at Grand View, a 5.1-point gap that compounds every year.
- Scope. Each house decides which brands, channels, garments and price tiers count as fast fashion, and none of the public summaries list the brands inside the total.
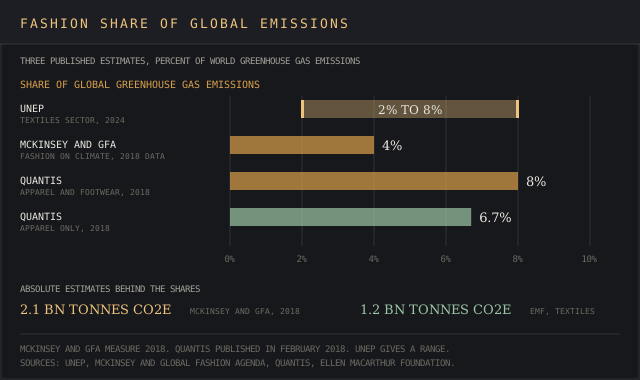
The devil's in the details for environmental figures as well. Three bodies publish a share of global emissions for the fashion industry, and the range runs from 2% to 8%.
Water shows the same pattern. UNEP puts industry use at 215 trillion litres of water annually. Niinimäki and co-authors, writing in Nature Reviews Earth & Environment in April 2020, put it at 79 trillion litres of water annually, the same 79 billion cubic metres the Pulse 2017 report used for 2015.
Quote the house and the year with every number. Readers who build their own estimate can start from our market sizing template, which separates top-down and bottom-up inputs.
Fast fashion industry statistics by company: Inditex, H&M, Fast Retailing and Shein
Filings from listed companies give harder numbers than any market model, because auditors sign them. These are the four fast fashion retailers this report tracks, with their latest results:
- Inditex, owner of Zara, Bershka and Pull&Bear, reported sales of €39.864 billion in the year to 31 January 2026, up 3.2% or 7% at constant currency. Net income rose 6% to €6.220 billion, gross margin was 58.3% and online sales reached €10.656 billion, 26.7% of the total, across 214 markets.
- Inditex's first half of 2026 brought sales of €19.755 billion, up 7.6% or 9.2% at constant currency, with net income of €2.980 billion and a 58.7% gross margin.
- H&M Group reported net sales of SEK 228,285 million in the year to November 2025, down 2.6% in kronor and up 2% in local currencies, with an 8.1% operating margin.
- H&M's third quarter of 2026 brought sales of SEK 57,189 million, up 1% in local currencies, and a 10.6% operating margin. H&M attributes about 1.6 points of that margin to one-off tariff effects.
- Fast Retailing, owner of Uniqlo, booked revenue of ¥3.4005 trillion in the year to August 2025, up 9.6%, with Uniqlo International at ¥1.9102 trillion and a ¥3.75 trillion target for fiscal 2026.
- Shein, privately held, discloses environmental data on its own site. Its sustainability disclosures put recycled polyester at 9.2% of the polyester in Shein-branded products in 2025, up from 6.7%, with a target of 31% by 2030.
Inditex's 58.3% gross margin on €39.9 billion of sales left €23.2 billion of gross profit, according to the same results.
Retail teams benchmarking these clothing companies against each other usually pull the data from tools in our retail analytics software rankings.
Clothing production and fibers: 139 million tonnes, 59% polyester
Fiber output grew 5.3% in one year. Textile Exchange counted 132 million tonnes in 2024 and 125 million in 2023, before the 139 million tonnes of 2025.
Polyester holds 59% of the world's 139 million tonnes, more than half of all fiber, or 82.5 million tonnes. Textile Exchange's 2025 report found 88% of polyester is made from fossil fuels. Recycled polyester came to 9.7 million tonnes in 2025, about 11.8% of polyester output. Keep an eye on the feedstock, because most of it is made from plastic bottles. Cotton, conventional and organic cotton together, held 18%.
Synthetic fibers tie fast fashion and textile production to fossil fuels. Changing Markets' Fossil Fashion report from February 2021 calculated that making synthetic fibers takes 1.35% of global oil consumption, more than Spain's annual oil use.
Its September 2024 follow-up, Fashion's Plastic Paralysis, found synthetic textiles made up 82% of Shein's garment production and 69% of the fibres used by Boohoo, another of the fast fashion brands it surveyed. Inditex disclosed 212,886 tonnes of synthetics for 2023, up from 178,030 tonnes in the previous survey.
Clothing production doubled between 2000 and 2015 to more than 100 billion garments a year, by the Ellen MacArthur Foundation's count. The same report says the industry draws 98 million tonnes of non-renewable resources each year. McKinsey found garments purchased per person rose about 60% from 2000 to 2014. Over 15 years, the Ellen MacArthur Foundation adds, the average number of times clothes are worn before they're discarded fell 36%.
UNEP measures it per head. Textile production rose from 8.3 kg per person in 1975 to 15.5 kg in 2023 and is projected to hit 18.8 kg by 2030. Textile manufacturing in those volumes runs on large quantities of water & roughly 3,500 chemicals, UNEP adds.
Environmental impact of fast fashion by emissions, water and plastic
Most measures of the environmental impact of fast fashion scale with volume. More garments mean more fiber, dye and freight, so the production figures above drive the numbers below.
Carbon emissions and greenhouse gases
McKinsey & the Global Fashion Agenda's Fashion on Climate report put the industry at 2.1 billion tonnes of greenhouse gases in 2018, 4% of global carbon emissions. About 70% came from upstream steps such as materials production, preparation and processing.
Without new action, that report projects 2.7 billion tonnes by 2030, against the 1.1 billion tonnes a 1.5°C pathway allows. Closing that gap by 2030 is a race against time. The Ellen MacArthur Foundation's 1.2 billion tonnes for textile production alone is more than all international flights and maritime shipping combined.
Quantis, which puts apparel and footwear at 8% of the world's greenhouse gas emissions in its Measuring Fashion study of February 2018, also split apparel's carbon footprint by stage. Dyeing & finishing made up 36%, yarn preparation 28% and fiber production 15%. Those three stages, 79% combined, run on fiber and finish choices made at the design stage.
Per person, the European Parliament puts EU textile purchases in 2022 at about 355 kg of CO2 each. That carbon footprint arrives before the garments are ever washed.
Water use and water pollution
One cotton t-shirt takes 2,700 litres of fresh water to make, according to the European Parliament. That's roughly 713 US gallons.
The same source attributes about 20% of global clean water pollution to textile manufacturing, mainly from the dyeing process. UNEP's 215 trillion litres a year equals 86 million Olympic swimming pools.
Microplastics and plastic pollution
Washing synthetic textiles releases 34.8%, roughly 35%, of the primary microplastics that reach the world's oceans, according to the IUCN's Primary Microplastics in the Oceans study of 2017. Its central estimate for all primary microplastics is 1.5 million tonnes a year.
The Ellen MacArthur Foundation puts the microfiber flow from clothing at about half a million tonnes a year. UNEP's broader measure, covering all microplastic pollution reaching the world's oceans, assigns textiles 9%.
Plastic waste from garments goes beyond fibers in the sea. A Nature Communications study led by Anna Kounina, published 12 June 2024, found the apparel industry leaked 8.3 million tonnes of plastic pollution into the environment in 2019, 14% of global plastic leakage, from about 21 million tonnes of plastic waste. Garments made from synthetic fibers produced 89% of the industry's macroplastic waste.
Investors screening brands on sustainable fashion claims & these environmental issues can compare emissions disclosures with tools from our ESG data provider rankings. Data centres are the other water story of 2026, and our AI environmental impact statistics report sizes it.
Textile waste statistics for landfill, incineration and recycling
The fashion industry generated 92 million tonnes of waste in 2015, according to the Pulse of the Fashion Industry 2017 report from the Global Fashion Agenda and BCG. It projected 148 million tonnes by 2030 as apparel and footwear consumption rises 63%, from 62 million to 102 million tonnes.
Recycling is a drop in the bucket. The Ellen MacArthur Foundation found 73% of clothing material ends up landfilled or incinerated and 13% gets recycled in some way, mostly into lower-value uses. Less than 1% becomes new clothing, a loss it values at more than $500 billion a year. The European Parliament puts the share of used clothes recycled into new clothes at 1%.
The US Environmental Protection Agency's latest textiles data covers 2018. Americans generated 17 million tons of textile waste, 5.8% of all municipal solid waste.
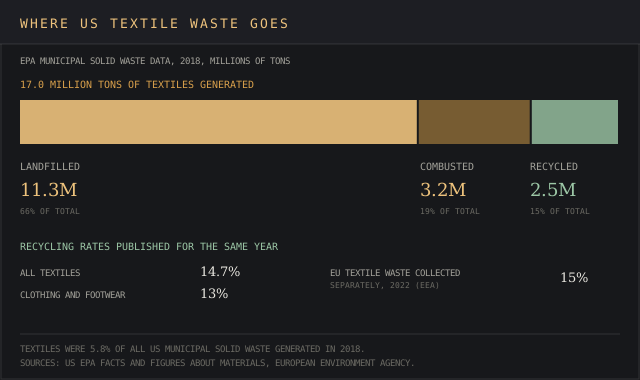
Landfill took 11.3 million tons, or 66%. Incineration with energy recovery took 3.2 million tons (19%) and recycling 2.5 million tons, a 14.7% rate. For clothing and footwear alone the recycling rate was 13%.
The European Environment Agency reported in March 2025 that the EU generated 6.94 million tonnes of textile waste in 2022, 16 kg per person, and collected 15% of it separately. The other 85% went into mixed household waste.
Consumption keeps climbing alongside it. Consumers in the EU bought 19 kg of textiles each in 2022, up from 17 kg in 2019: 8 kg of clothing, 7 kg of household textiles and 4 kg of footwear.
Some waste never reaches a customer. The European Commission estimates 4% to 9% of textiles placed on the EU market are destroyed before use, between 264,000 and 594,000 tonnes a year.
Garment workers' wages, safety and gender split
The garment industry employs more than 90 million people around the world, 75% of them in Asia, according to an ILO brief from March 2025.
Women make up nearly 60% of garment workers across the world and close to 80% in some regions, the ILO reports. Asia alone employs about 42 million women in the sector, Vietnam's workforce is 79% female, and the average gender pay gap across nine Asian producing countries is 18.5%. The ILO adds that most women in the sector are young women, so maternity and childcare gaps hit the workforce early.
The ILO brief shows how far lower wages in developing nations sit below pay where the clothes are sold. It cites 2019 monthly minimum wages from $26 in Ethiopia to $357 in Guatemala, against averages of $1,736 in Belgium and $1,734 in the UK.
Bangladesh raised its garment minimum wage to 12,500 taka a month, about $113, in December 2023, from 8,000 taka set in 2018. The Fair Labor Association calculated the new rate still sits 51.78% below the Global Living Wage Coalition's benchmark for Dhaka.
Talk is cheap on pay. Clean Clothes Campaign's 2026 Fashion Checker reviewed 110 fashion brands and found 32% with a public commitment, 4% with tangible progress and 3% disclosing wage levels. Surveyed workers earned 73% less than Fashion Checker's wage benchmark in Bangladesh, 74% less in Pakistan, 66% less in Turkey and 63% less in Serbia.
Factory safety has its own count. On 24 April 2013 the Rana Plaza building in Dhaka, home to five garment factories, collapsed and killed at least 1,134 people, according to the ILO. More than 2,500 were injured. Five months earlier, the Tazreen factory fire had killed at least 112 workers, the ILO notes.
Few of the largest fashion brands disclose emission reduction targets for their supply chains. Fashion Revolution's What Fuels Fashion? 2025 scored 200 fashion brands with turnover above $1 billion and found an industry average of 14%, a red flag for anyone relying on brand climate pledges:
- 18% disclose a coal phase-out target for material processing.
- 10% disclose supply chain renewable electricity targets.
- 6% disclose efforts to electrify high-heat processes.
- 15% link executive bonuses to absolute emissions cuts.
Those shares measure disclosure of sustainable practices. Teams mapping the garment factories behind these brands use the platforms in our supply chain intelligence rankings.
Fashion consumers and fashion habits: Gen Z, resale and ultra-fast fashion
Consumer awareness doesn't stop purchases from ultra-fast fashion brands. A Scientific Reports study of 1,009 US consumers, published 7 October 2025, found a small negative correlation between knowledge of fashion's environmental effects and sustainable action.
The same respondents raised online purchases of new clothes 38% between 2020 and 2024, and their buying from ultra-fast fashion brands rose 24.6%. Their fashion habits show the gap in numbers:
- 40% own clothes they've never worn.
- 37.9% discard fashion items within a year of purchase.
- 25% discard items still in good condition.
- Secondhand & new clothing spending moved together, with a correlation of 0.58.
So shoppers who know the harms still buy at low prices, and secondhand spending tops up new purchases. The true cost lands later, in the 37.9% of items discarded within a year.
Resale grows anyway. ThredUp's 2026 Resale Report expects global secondhand apparel to reach $393 billion by 2030, about twice the pace of overall apparel retail, from roughly 10% of apparel spend in 2025.
In the US, resale grew nearly four times faster than retail clothing in 2025 and is forecast at $78.8 billion by 2030. ThredUp, which surveyed 3,268 US consumers for the report, expects Gen Z & Millennials to supply 71% of the market's growth through 2030, and nearly half of shoppers find their next secondhand item through social media.
The jury's still out on sustainable fashion displacing fast fashion purchases. Resale, repair & other slow fashion models grow from a base of about a tenth of spend, while McKinsey's State of Fashion expects secondhand to grow two to three times faster than firsthand through 2027.
Gen Z's discovery habits run through feeds, which our social media statistics and Instagram statistics reports quantify. Brands tracking that conversation use the tools in our social listening rankings.
E-commerce carries the ultra-fast model. US e-commerce sales reached $340.2 billion in the second quarter of 2026, 17.1% of retail, up 12.2% year over year, according to the Census Bureau. Inditex's e-commerce sales of €10.656 billion show the same shift at one retailer.
Cheap cross-border e-commerce parcels flew under the radar for years. A June 2026 Federal Register rule records more than 1.36 billion de minimis shipments processed by CBP in fiscal 2024, against 139 million in 2015. The rule suspends the duty-free postal exemption indefinitely, with a new postal entry process from 24 July 2026.
Textile waste and green claims rules in the European Union
Governments have tightened rules on textile waste, imports and environmental claims since 2025. The European Union now regulates fashion at both ends of the product's life with rules meant to support sustainable clothing, and they apply to sustainable brands and fast fashion companies alike. They target the waste end of the impact of fast fashion:
- Separate collection. Member states have had to collect textiles separately since January 2025.
- Extended producer responsibility. In September 2025 the European Parliament approved rules making producers of clothing, footwear, accessories and household textiles cover the cost of collecting, sorting and recycling them.
- Destruction ban. Since 19 July 2026, large companies can't destroy unsold garments and footwear except in listed cases such as unsafe or counterfeit goods, and the rule is set in stone in EU law. Medium-sized companies follow from 2030, and records must be kept for five years.
- Green claims. Directive (EU) 2024/825 bans generic environmental claims a company can't substantiate, with national rules applying from 27 September 2026.
Analysts following these rules alongside product launches can log them in our trend tracker template.
How these fast fashion statistics were collected
Every fast fashion figure on this page was checked against its publisher between September and October 2026. Market sizes come from the research houses' own report pages & company numbers come straight from the horse's mouth in results releases. Environmental impact and labor data come from UN bodies, EU agencies, US agencies, peer-reviewed journals and the NGOs that ran the surveys.
Where only a press release summarises a study, the release is linked and the study named. Analysts building their own fast fashion trackers can compare the tools in our trend research tools rankings.
Where every fast fashion figure was read, and the totals no publisher has yet
Market sizes come from grandviewresearch.com (August 2026), researchnester.com (31 October 2025), fortunebusinessinsights.com (14 September 2026), thebusinessresearchcompany.com (September 2026 edition) and alliedmarketresearch.com (August 2023).
Industry sales and prices come from euromonitor.com (12 March 2026), statista.com (Statista Market Insights, apparel worldwide), mckinsey.com (The State of Fashion 2026 with The Business of Fashion, November 2025, and the fast fashion explainer of 23 January 2025) and bls.gov (CPI release of 11 September 2026).
Company figures come from inditex.com (FY2025 results of 11 March 2026, first-half 2026 results of 9 September 2026), hmgroup.com (full-year report of 29 January 2026, nine-month report of 24 September 2026), fastretailing.com (FY2025 results of 9 October 2025) and sheingroup.com (planet page).
Fiber data comes from textileexchange.org (Materials Market Report 2025, and the 2026 edition of 22 September 2026) and changingmarkets.org (Fossil Fashion, February 2021; Fashion's Plastic Paralysis, September 2024).
Emissions, water and plastic figures come from unep.org (29 November 2024), mckinsey.com (Fashion on Climate, 2020), csrwire.com (Quantis Measuring Fashion release, 28 February 2018), ellenmacarthurfoundation.org (A New Textiles Economy, 2017), nature.com (Nature Reviews Earth & Environment, 7 April 2020; Nature Communications, 12 June 2024), portals.iucn.org (Primary Microplastics in the Oceans, 2017) and europarl.europa.eu.
Waste tonnage and EU rules come from copenhagenfashionsummit.com (Pulse of the Fashion Industry 2017), epa.gov (2018 textiles data), eea.europa.eu (26 March 2025), environment.ec.europa.eu (17 July 2026) and eur-lex.europa.eu (Directive (EU) 2024/825).
Labor figures come from ilo.org (brief of March 2025), webapps.ilo.org (garment gender InfoStory), social-protection.org (ILO Rana Plaza project page), fairlabor.org (Bangladesh wage trends, January 2024), cleanclothes.org (Fashion Checker, 23 September 2026) and fashionrevolution.org (What Fuels Fashion? 2025).
Consumer and trade figures come from nature.com (Scientific Reports, 7 October 2025), ir.thredup.com (2026 Resale Report, 2 April 2026), census.gov (18 August 2026) and federalregister.gov (24 June 2026).
Every figure was checked against its source by 4 October 2026. Shein keeps its accounts private, and its own emissions totals for 2024 and 2025 use boundaries it doesn't explain, so neither appears here. No research house lists the brands inside its fast fashion total, and the EPA's textile series stops at 2018.
Frequently asked questions
Is the fashion industry growing or declining?
The global fashion industry is growing slowly. McKinsey and BoF forecast 1% to 3% revenue growth for 2026, and Euromonitor expects the wider apparel sector to grow below 1% a year through 2030 from $1.8 trillion in 2025.
Is fast fashion growing or shrinking?
Fast fashion is growing. Every research house projects expansion, at 6.6% to 11.7% a year. Among fast fashion brands with public accounts, Inditex's first-half 2026 sales rose 7.6%. H&M grew 1% in local currencies in its third quarter of 2026.
Is fashion the biggest polluting industry?
Published estimates put textiles at 2% to 8% of the world's emissions (UNEP) and fashion at 4% of global carbon emissions (McKinsey and the Global Fashion Agenda). The Ellen MacArthur Foundation's 1.2 billion tonnes for textile production exceeds international flights and maritime shipping combined.
Is it true that 85% of all textiles go to dumps each year?
The 85% matches the EEA's share of EU textile waste that wasn't collected separately in 2022, and that share went into mixed household waste. Globally, the Ellen MacArthur Foundation puts landfill & incineration at 73% of clothing material, and the EPA put US landfill at 66% in 2018.
What are 10 concerning statistics about fast fashion waste?
- 92 million tonnes of fashion waste in 2015 (Pulse 2017).
- 148 million tonnes projected for 2030 (Pulse 2017).
- 73% of clothing material landfilled or incinerated (Ellen MacArthur Foundation).
- Less than 1% recycled into new clothing (Ellen MacArthur Foundation).
- $500 billion lost each year to underuse and lack of recycling (Ellen MacArthur Foundation).
- 11.3 million tons of US textiles landfilled in 2018 (EPA).
- 13% recycling rate for US clothing and footwear (EPA).
- 16 kg of textile waste per EU resident in 2022 (EEA).
- 264,000 to 594,000 tonnes of unsold EU textiles destroyed each year (European Commission).
- 8.3 million tonnes of apparel plastic pollution in 2019 (Nature Communications).
What is the 3-3-3 rule for fashion?
It's a capsule-wardrobe rule shared on social media. Pick three tops, three bottoms and three pairs of shoes, and the combinations give 27 outfits from nine pieces.
Bottom line
Fast fashion is a $161.7 billion to $240.0 billion market by 2025 estimates, depending on the house, inside a $1.8 trillion apparel and footwear industry. McKinsey expects fashion revenue to grow 1% to 3% this year.
Inditex, H&M and Fast Retailing, the fast fashion retailers with public accounts, report audited numbers. Shein publishes environmental data on its own site and keeps its accounts private.
The physical numbers move in one direction. Fiber output rose from 132 million to 139 million tonnes in a year, polyester holds 59%, and under 1% of clothing material comes back as clothing.
Cite the publisher and year with every fast fashion figure on this page, because the houses, agencies and NGOs measure different things. The two numbers least likely to be challenged are the audited ones, company sales, and the counted ones, EPA and EEA waste tonnage.