Plastic pollution statistics 2026: 353 million tons of waste, 9% recycled
 By Jan Suski. I go deep on every review, checking every number against its source and digging up details other coverage misses, a habit from six years of SEO and link building for tech companies. Bylines at Brand24 and Senuto. How the scoring works.
The numbers Global plastic production, waste and leakage, checked 19 November 2026
More plastic waste goes into landfills than is recycled and incinerated combined.
The ocean receives about 0.5% of plastic waste, roughly 1.7 million tons of plastic entering oceans annually, and rivers hold 109 million tons that haven't reached it yet.
High income countries generate the most plastic waste per person, and lower-income countries leak the most plastic pollution.
I'll write a 2,500+ word report on the market you name, with OECD, UNEP and national agency data linked to its sources. Yours to publish, from $200.
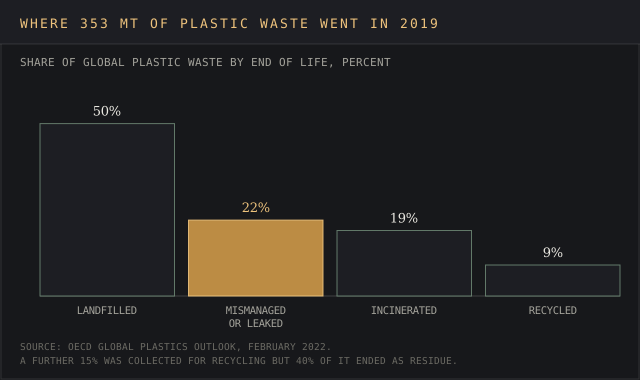
The world produced 353 million tons of plastic waste in 2019 and recycled 9% of it, according to the OECD's Global Plastics Outlook. Half went to landfills, 19% was incinerated and 22% escaped waste management systems into dumps, open burning, rivers and the sea. Plastic production has since reached 430.9 million tons a year.
These plastic pollution statistics cover how much plastic the world makes and recycles, how much waste it generates, where that waste ends up, which countries leak the most plastic pollution, what reaches the ocean, and where the global plastics treaty stands in 2026. Global figures are metric tons, and each links to the agency, industry body or journal that published it.
The page is for researchers, sustainability teams and journalists who need numbers they can cite. Estimates of how much plastic enters the ocean range from 1.7 million to 14 million tons a year depending on what is counted, so the definitions matter as much as the figures.
Global plastic production
The world produced about 2 million tons of plastic in 1950 and about 460 million tons in 2019, a roughly 230-fold rise, per Our World in Data. Plastic production doubled in the two decades to 2019.
Plastics Europe's Plastics the Fast Facts 2025 puts world plastics production at 430.9 million tons in 2024, with bio-based plastics at 0.6%. The feedstock is oil and gas, the business covered in our oil and gas market intelligence guide. Asia produced 57.2% and China alone 34.5%, Packaging Gateway reported from the same data, while Europe's share fell to 12% from 22% in 2006, a shift resin buyers follow through supply market intelligence.
The two production series use different scopes. Plastics Europe's figure excludes PET, PA and polyacryl fibres, which the OECD's 460 million tons for 2019 counts, so the lower 2024 number doesn't mean output fell. Recycled plastic made up 29.1 million tons of the OECD's 2019 total, about 6%, and virgin plastic the rest.
How much plastic waste the world generates
Global plastic waste reached 353 million tons in 2019, more than double the 2000 level, per the OECD. Nearly two-thirds of it came from plastics with lifetimes under five years: packaging, consumer goods and textiles.
- Packaging: 40% of plastic waste, including food packaging, PET bottles, plastic bags and other single use plastics.
- Consumer goods: 12%, such as disposable diapers and trash bags.
- Clothing and textiles: 11%, covered in our fashion industry statistics.
- Construction and transport: longer-lived uses, from pipes to car parts, tracked in our construction market intelligence and automotive industry statistics pages.
Single use plastics drive the waste numbers because they turn into waste within months. Packaging uses polymers such as high density polyethylene, low density polyethylene and PET, the polymer that turned up most often in the blood study below. Ecommerce adds shipping packaging to that stream, and our ecommerce statistics track the sales behind it, while checkout plastic bags show up in our retail industry statistics.
Where plastic waste ends up
Half of all plastic waste generated is landfilled, the most common form of disposal by weight. The OECD breakdown for 2019 is below.
Copy these lines into an email, fill them in and send. I reply with scope and a price within 2 to 3 business days.
Open the email| End of life | Share of plastic waste, 2019 | Approximate tons |
|---|---|---|
| Landfilled | 50% | 177 million |
| Mismanaged (dumped, openly burned or leaked) | 22% | 78 million |
| Incinerated, often with energy recovery | 19% | 67 million |
| Recycled | 9% | 32 million |
The recycling rate looks better than it is. Another 15% of plastic waste was collected for recycling in 2019, but 40% of that collected material was disposed of as residue, per the OECD. Mismanaged waste goes to uncontrolled dumpsites, is openly burned, or leaks into soil, land and water. UNEP's assessment lists open burning among the routes by which plastic waste affects human health.
The United States reports its own figures. The EPA's plastics material data for 2018, in U.S. short tons, show 35.7 million tons of plastic waste generated, 12.2% of municipal solid waste, with an 8.7% recycling rate, 5.6 million tons combusted with energy recovery and 27 million tons sent to landfills. PET bottles and jars were recycled at 29.1% and natural HDPE bottles at 29.3%.
Which countries produce the most plastic pollution
Plastic waste and plastic pollution are different measurements, and the countries that produce the most plastic waste aren't the ones with the most plastic pollution. High income countries generate more plastic waste per person, and the OECD puts the United States at 221 kg per person a year against 114 kg in European OECD countries and 69 kg in Japan and Korea. Americans generate about four times as much plastic waste per person as Indians, Our World in Data reports.
Leakage runs the other way. OECD countries generate almost half of global plastic waste but account for 14% of plastic leakage. Low- and lower-middle-income countries produce over 50 times the plastic pollution per person of high income countries, because their waste management systems collect less of it, according to Our World in Data's analysis of Meijer et al. (2021).
| Measure | High income countries | Low and lower-middle income countries |
|---|---|---|
| Plastic waste per person | More than four times low-income levels | Lowest |
| Share of global plastic leakage (OECD members) | 14% | Most of the remaining 86% |
| Plastic pollution per person | Lowest | Over 50 times high-income levels |
- The materials, countries or waste streams to compare
- Regions, years and segments
- Where it runs: blog, white-label, gated or lead magnet
- Whose byline goes on it
- Deadline
- 2,500+ words, human-written
- Every figure linked to its source
- Yours to publish, under your name or none
- Hosting here for +$200, with your sponsored links
The countries with the most plastic pollution reaching the sea are in Asia. Meijer's river model, summarized by Our World in Data, ranks the Philippines, India, Malaysia, China and Indonesia as the five largest emitters, together about 70% of riverine ocean plastic, and found more than 1,000 rivers account for 80% of global riverine emissions. The Philippines is also the largest emitter per person.
How much plastic enters the ocean each year
Between 1 and 2 million tons of plastic enter the oceans annually as ocean pollution, with the OECD central estimate at 1.7 million tons in 2019. That's about 0.5% of plastic waste. A larger 6.1 million tons leaked into aquatic environments that year, including rivers and lakes, and rivers held an accumulated 109 million tons of plastic debris. Seas and oceans held about 30 million tons.
Plastic accounts for 85% of marine litter, according to UNEP's From Pollution to Solution assessment, published 21 October 2021. The same report estimated 9 to 14 million tons of plastic entering aquatic ecosystems in 2016 and projected 23 to 37 million tons a year by 2040 without new policy.
Fishing is the main source in some places. More than three-quarters of the floating plastic in the Great Pacific Garbage Patch comes from fishing activities, Our World in Data reports. Closer to shore, rivers carry land-based plastic litter to the coast, which is the flow Meijer's model estimates.
Why ocean plastic estimates disagree
Figures of 8 to 11 million tons a year still circulate, while the OECD says 1.7 million tons. The gap comes from what each estimate counts. UNEP's 9 to 14 million tons covers all aquatic ecosystems, rivers and lakes included, for 2016. The OECD splits its 2019 estimate into 6.1 million tons leaking to all water and 1.7 million tons reaching the ocean, and Meijer's river model, which estimates how much river plastic reaches the coast, lands in the same range.
| Estimate | Publisher | What it counts |
|---|---|---|
| 9 to 14 million tons (2016) | UNEP | Plastic entering all aquatic ecosystems |
| 6.1 million tons (2019) | OECD | Plastic leaking to aquatic environments |
| 1.7 million tons (2019) | OECD | Plastic flowing into the ocean |
| 1 to 2 million tons | Our World in Data, using the Meijer et al. river model | River plastic reaching the ocean |
Quote the number with its scope. "Plastic entering water" and "plastic entering the ocean" differ by a factor of four in the OECD's own figures for the same year.
Is plastic pollution getting worse?
Every series in these plastic pollution statistics points the same way. The rapid growth of plastic production, from 2 million tons in 1950 to 430.9 million tons in 2024, means more plastic waste each year, and more plastic waste in places without collection means more plastic pollution.
Plastic use per person is highest in rich countries, at 221 kg of plastic waste per American each year, and 2024 output was about 4% above 2023, Premium Beauty News reported from Plastics Europe's data.
UNEP's synthesis report projected plastic pollution leaking into aquatic ecosystems to rise from an estimated 19 to 23 million tons a year in 2016 to around 53 million tons a year by 2030, and ocean pollution flows to nearly triple by 2040. UNEP describes an urgent need to cut unnecessary, avoidable and problematic plastic, with single use plastics such as bags and food wrappers as the main example, and to reuse more of what remains.
- Production: up roughly 230-fold since 1950 by weight, with more plastic produced in 2024 than in any earlier year, per Plastics Europe data on Statista.
- Waste: more than doubled between 2000 and 2019.
- Recycling: 9% of plastic waste recycled in 2019, with recycled plastic at about 6% of production.
- Leakage: projected to keep rising without new policy in the UNEP and OECD scenarios.
The biggest risk sits with discarded plastic that never reaches formal disposal. Mismanaged waste sits mostly in countries with thin collection systems, and the OECD puts the cost of better collection in low- and middle-income countries at EUR 25 billion a year. UNEP put the 2018 cost of marine plastic pollution to tourism, fishing and aquaculture, with clean-up, at $6 billion to $19 billion.
Plastic pollution, human health and animals
Microplastics have been found in human blood. A Vrije Universiteit Amsterdam team, publishing in Environment International in May 2022, found quantifiable plastic particles in the blood of 17 of 22 healthy donors, at a mean of 1.6 micrograms per milliliter. PET, the plastic in drinks bottles, was the most common polymer.
The health effects are still being measured. UNEP's assessment says microplastics can enter the body through food, drink and the air and accumulate in organs including the placenta. Most health research so far has studied additives such as BPA, the harmful chemicals mixed into plastic, and less is known about the polymer particles, researchers told Business Insider.
Animals take the direct hit from polluting plastic. UNEP lists plankton, shellfish, birds, turtles and mammals as facing toxification, starvation and suffocation from plastic, and corals, mangroves and seagrass beds as smothered by it. Plastic pollution of the natural environment also reaches soil through dumped waste, one of the OECD's mismanaged routes.
Plastics and climate
Plastics produced 3.4% of global greenhouse gas emissions in 2019, per the OECD. With bio-based plastics at 0.6% of 2024 production, nearly all plastic starts as oil or gas, the feedstock side of our energy market intelligence guide. The energy use behind that chain sits alongside our renewable energy statistics and AI environmental impact statistics, two other sectors measured by emissions.
Plastics produced 3.4% of global greenhouse gas emissions in 2019, per the OECD's Global Plastics Outlook.
Plastics' share of global greenhouse gas emissions in 2019
Source: OECDe.g. emissions or recycling rates for your material
Source: linked, checked, datedGlobal trade in plastic waste
Global trade in plastic waste has fallen since its 2016 peak. About 3.2 million tons of plastic waste were traded in 2024, just under 1% of the total, and high income countries exported about 90% of it, Our World in Data reports. China's 2018 import ban drove most of the decline.
What is being done to reduce plastic pollution
The global plastics treaty has no text yet. UN member states agreed in March 2022 to negotiate one, but the fifth session failed to reach agreement in Busan in December 2024, and the resumed talks in Geneva ended on 15 August 2025 without consensus. A one-day session on 7 February 2026 elected Chile's Julio Cordano as the new chair, with no substantive negotiations, per the Earth Negotiations Bulletin.
The split is over production. The EU, many African, Pacific and Latin American states pushed for production limits and phase-outs of harmful products, while petrochemical-producing states favored recycling, waste management and voluntary steps, Outlook Business reported. The OECD estimates low- and middle-income countries need about EUR 25 billion a year to improve waste management infrastructure.
Moving toward a circular economy means reuse, better collection, safer disposal and more recycled content in new products, the main ways to reduce plastic pollution at source. Plastics Europe reports that circular plastics production in Europe stalled at about 8 million tons in 2024, 15% of the EU's plastics output. A circular plastics economy at global scale would need recycling to grow far beyond its 9% share.
Delivered for your site and your byline. Hosting here is optional.
Frequently asked questions
How much plastic waste is generated every year?
353 million tons in 2019, the latest global year the OECD has published. Plastic production reached 430.9 million tons in 2024.
Is it true that only 9% of plastic is recycled?
The 9% figure holds for 2019. The OECD put the global recycling rate at 9%, and the EPA put the U.S. rate at 8.7% for 2018.
Is it true that 99% of plastic is made from fossil fuels?
Close to it. Bio-based and bio-attributed plastics made up 0.6% of 2024 production, per Plastics Europe, and recycled plastic was itself made from fossil feedstock the first time around.
How much plastic enters the ocean every year?
About 1.7 million tons in 2019 by the OECD estimate, and 6.1 million tons into all water bodies. UNEP's wider estimate for 2016 was 9 to 14 million tons into aquatic ecosystems.
Is plastic waste increasing or decreasing?
Increasing. Plastic waste more than doubled between 2000 and 2019, and production rose again to 430.9 million tons in 2024.
What share of municipal waste is plastic?
Plastic made up 12.2% of U.S. municipal solid waste by weight in 2018, per the EPA, and 18.5% of all municipal waste sent to landfills.
Bottom line
The world made 430.9 million tons of plastic in 2024 and, in the latest global count, recycled 9% of its plastic waste. The biggest share, 50%, goes to landfills, and the 22% that's mismanaged is the source of most plastic pollution.
Ocean figures vary from 1.7 million to 14 million tons a year depending on scope, and the treaty meant to reduce plastic pollution has a new chair and no agreed text.
Packaging firms, recyclers and ESG consultants use reports like this one in client briefs and policy submissions.
A report on your topic for a blog page, gated content or a lead magnet.
Written for your client and published under their brand, with my name left off.
Your report on marketintelligencetools.com, with 2 to 3 CTAs carrying your sponsored links.
Default terms: the report is yours to publish, and I keep the right to republish it on this site behind a gate, outside Google's index.
Where each plastic figure comes from, and why every ocean number is a model
International bodies: oecd.org (Global Plastics Outlook release, February 2022), unep.org (From Pollution to Solution release, 21 October 2021; INC-5.2 and INC-5.3 session pages), wedocs.unep.org (From Pollution to Solution synthesis) and enb.iisd.org (Earth Negotiations Bulletin, 7 February 2026). National data: epa.gov (plastics material-specific data for 2018, page updated 13 March 2026).
Industry and research: plasticseurope.org (Plastics the Fast Facts 2025, October 2025), ourworldindata.org (plastic pollution topic page), science.org (Meijer et al., Science Advances, 2021) and doaj.org (Leslie et al., Environment International, May 2022). Coverage: packaging-gateway.com, premiumbeautynews.com, statista.com, outlookbusiness.com and businessinsider.nl.
All figures checked 19 November 2026. The OECD's 2019 count is the latest published global plastic waste total, and no country measures the plastic entering the ocean directly, so every ocean figure above is a model estimate.